Saturn moon Enceladus shows more signs of activity

Enceladus south polar
These two side-by-side images compare a characteristic sea-floor spreading feature on Earth, known as a spreading ridge transform, to a very similar looking arrangement of “tiger stripe” rift segments in the south polar terrain region of Saturn’s moon Enceladus.
NASA/JPL/Space Science Institute
December 16, 2008
The closer scientists look at Saturn’s small moon Enceladus, the more they find evidence of an active world. The most recent flybys of Enceladus made by NASA’s Cassini spacecraft provide new signs of ongoing changes on and around the moon. Details in the latest high-resolution images of Enceladus indicate that the south polar surface changes over time.

Close views of the southern polar region, where jets of water vapor and icy particles spew from vents within the moon’s distinctive “tiger stripe” fractures, provide surprising evidence of earthlike tectonics. They yield insight into what may be happening within the fractures. The latest data on the plume — the huge cloud of vapor and particles fed by the jets that extend into space — show it varies over time and has a far-reaching effect on Saturn’s magnetosphere.

“Of all the geologic provinces in the Saturn system that Cassini has explored, none has been more thrilling or carries greater implications than the region at the southernmost portion of Enceladus,” said Carolyn Porco, Cassini imaging team leader at the Space Science Institute in Boulder, Colorado.

A panel of Cassini scientists presented these new findings Monday in a news briefing at the American Geophysical Union’s Fall Meeting in San Francisco.

“Enceladus has earthlike spreading of the icy crust, but with an exotic difference — the spreading is almost all in one direction, like a conveyor belt,” said Paul Helfenstein, Cassini imaging associate at Cornell University in Ithaca, New York.

“Enceladus has asymmetric spreading on steroids,” Helfenstein said. “We are not certain about the geological mechanisms that control the spreading, but we see patterns of divergence and mountain-building similar to what we see on Earth, which suggests that subsurface heat and convection are involved.”

The tiger stripes are analogous to the mid-ocean ridges on Earth’s seafloor where volcanic material wells up and creates new crust. Using Cassini-based digital maps of the moon’s south polar region, Helfenstein reconstructed a possible history of the tiger stripes by working backward in time and progressively snipping away older and older sections of the map, each time finding that the remaining sections fit together like puzzle pieces.

Images from recent close flybys also have bolstered a theory that condensation from the jets erupting from the surface may create ice plugs that close off old vents and force new vents to open. The opening and clogging of vents also corresponds with measurements indicating the plume varies from month to month and year to year.

“We see no obvious distinguishing markings on the surface in the immediate vicinity of each jet source, which suggests that the vents may open and close and thus migrate up and down the fractures over time,” Porco said. “Over time, the particles that rain down onto the surface from the jets may form a continuous blanket of snow along a fracture.”

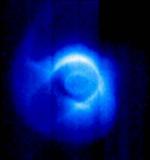
Enceladus’ output of ice and vapor dramatically impacts the entire Saturnian system by supplying the ring system with fresh material and loading ionized gas from water vapor into Saturn’s magnetosphere.

“The ions added to the magnetosphere are spun up from Enceladus’ orbital speed to the rotational speed of Saturn,” said Cassini magnetometer science team member Christopher Russell of the University of California, Los Angeles. “The more material is added by the plume, the harder this is for Saturn to do, and the longer it takes to accelerate the new material.”

With water vapor, organic compounds and excess heat emerging from Enceladus’ south polar terrain, scientists are intrigued by the possibility of a liquid-water-rich habitable zone beneath the moon’s south pole.

Dark energy found stifling growth in universe

Abell 85
Composite image of the galaxy cluster Abell 85.
X-ray (NASA/CXC/SAO/A.Vikhlinin et al.); Optical (SDSS)
December 16, 2008
For the first time, astronomers have clearly seen the effects of “dark energy” on the most massive collapsed objects in the universe using NASA’s Chandra X-ray Observatory. By tracking how dark energy has stifled the growth of galaxy clusters and combining this with previous studies, scientists have obtained the best clues yet about what dark energy is and what the destiny of the universe could be.

This work, which took years to complete, is separate from other methods of dark energy research such as supernovae. These new X-ray results provide a crucial independent test of dark energy, long sought by scientists, which depends on how gravity competes with accelerated expansion in the growth of cosmic structures. Techniques based on distance measurements, such as supernova work, do not have this special sensitivity.

Scientists think dark energy is a form of repulsive gravity that now dominates the universe, although they have no clear picture of what it actually is. Understanding the nature of dark energy is one of the biggest problems in science. Possibilities include the cosmological constant, which is equivalent to the energy of empty space. Other possibilities include a modification in general relativity on the largest scales, or a more general physical field.

To help decide between these options, a new way of looking at dark energy is required. It is accomplished by observing how cosmic acceleration affects the growth of galaxy clusters over time.

“This result could be described as ‘arrested development of the universe’,” said Alexey Vikhlinin of the Smithsonian Astrophysical Observatory in Cambridge, Massachusetts, who led the research. “Whatever is forcing the expansion of the universe to speed up is also forcing its development to slow down.”

Vikhlinin and his colleagues used Chandra to observe the hot gas in dozens of galaxy clusters, which are the largest collapsed objects in the universe. Some of these clusters are relatively close and others are more than halfway across the universe.

The results show the increase in mass of the galaxy clusters over time aligns with a universe dominated by dark energy. It is more difficult for objects like galaxy clusters to grow when space is stretched, as caused by dark energy. Vikhlinin and his team see this effect clearly in their data. The results are remarkably consistent with those from the distance measurements, revealing general relativity applies, as expected, on large scales.

“For years, scientists have wanted to start testing how gravity works on large scales and now, we finally have,” said William Forman, co-author of the study from the Smithsonian Astrophysical Observatory. “This is a test that general relativity could have failed.”

When combined with other clues — supernovae, the study of the cosmic microwave background, and the distribution of galaxies — this new X-ray result gives scientists the best insight to date on the properties of dark energy.

The study strengthens the evidence that dark energy is the cosmological constant. Although it is the leading candidate to explain dark energy, theoretical work suggests it should be about 10 raised to the power of 120 times larger than observed. Therefore, alternatives to general relativity, such as theories involving hidden dimensions, are being explored.

“Putting all of this data together gives us the strongest evidence yet that dark energy is the cosmological constant, or in other words, that ‘nothing weighs something’,” said Vikhlinin. “A lot more testing is needed, but so far Einstein’s theory is looking as good as ever.”

These results have consequences for predicting the ultimate fate of the universe. If dark energy is explained by the cosmological constant, the expansion of the universe will continue to accelerate, and the Milky Way and its neighbor galaxy, Andromeda, never will merge with the Virgo cluster. In that case, about a hundred billion years from now, all other galaxies ultimately would disappear from the Milky Way’s view and, eventually, the local superclusters of galaxies also would disintegrate.

Titan’s volcanoes give NASA spacecraft chilly reception

Infrared map of Titan's active regions
This infrared projection map of Titan was composed from images taken by NASA’s Cassini spacecraft, visual and infrared mapping spectrometer. The location of two regions that changed in brightness are labeled. These regions are hypothesized by some to be areas of cryovolcanic activity on Titan.
NASA/JPL/University of Arizona
December 16, 2008
Data collected during several recent flybys of Titan by NASA’s Cassini spacecraft provide supporting evidence to scientists who think the saturnian moon contains active cryovolcanoes spewing a super-chilled liquid into its atmosphere.

“Cryovolcanoes are some of the most intriguing features in the solar system,” said Rosaly Lopes, a Cassini radar team investigation scientist from NASA’s Jet Propulsion Laboratory (JPL) in Pasadena, California.

Rather than erupting molten rock, it is theorized that the cryovolcanoes of Titan would erupt volatiles such as water, ammonia, and methane. Scientists have suspected cryovolcanoes might inhabit Titan, and the Cassini mission has collected data on several previous passes of the moon that suggest their existence. Imagery of the moon includes a suspect haze hovering over flow-like surface formations. Scientists point to these as signs of cryovolcanism.

“Cassini data have raised the possibility that Titan’s surface is active,” said Jonathan Lunine, a Cassini interdisciplinary scientist from the Lunar and Planetary Laboratory, University of Arizona, Tucson. “This is based on evidence that changes have occurred on the surface of Titan, between flybys of Cassini, in regions where radar images suggest a kind of volcanism has taken place.”

What led some Cassini scientists to believe that things are happening now were changes in brightness and reflectance detected at two distinct regions of Titan. Reflectance is the ratio of light that radiates onto a surface to the amount reflected back. These changes were documented by Visible and Infrared Mapping Spectrometer data collected on Titan flybys from July 2004 to March 2006. In one of the two regions, the reflectance of the surface surged upward and remained higher than expected. In the other region, the reflectance shot up but then trended downward. There is also evidence that ammonia frost is present at one of the two changing sites. The ammonia was evident only at times when the region was inferred to be active.

“Ammonia is widely believed to be present only beneath the surface of Titan,” said Robert M. Nelson of JPL, a scientist for Cassini’s Visual and Infrared Mapping Spectrometer team. “The fact that we found it appearing at times when the surface brightened strongly suggests that material was being transported from Titan’s interior to its surface.”

Some Cassini scientists indicate that such volcanism could release methane from Titan’s interior, which explains Titan’s seemingly continuous supply of fresh methane. Without replenishment, scientists say, Titan’s original atmospheric methane should have been exhausted long ago.

But other scientists familiar with the spectrometer data argue that the ammonia identification is not certain, and that the purported brightness changes might not be associated with changes on Titan’s surface. Instead they might result from the transient appearances of ground “fogs” of ethane droplets very near Titan’s surface, driven by atmospheric rather than geophysical processes. Nelson has considered the ground fog option, stating, “There remains the possibility that the effect is caused by a local fog, but, if so, we would expect it to change in size over time due to wind activity, which is not what we see.”

An alternative hypothesis to an active Titan suggests the saturnian moon could be taking its landform evolution cues from a moon of Jupiter.

“Like Callisto, Titan may have formed as a relatively cold body, and may have never undergone enough tidal heating for volcanism to occur,” said Jeffrey Moore, a planetary geologist at the NASA Ames Research Center, Moffett Field, California. “The flow-like features we see on the surface may just be icy debris that has been lubricated by methane rain and transported down slope into sinuous piles like mudflows.”

New region of magnetosphere is identified

Earth's Magnetosphere
View of Earth’s magnetosphere from above the north pole.
NASA / IMAGE Science Team
December 15, 2008
According to new data from five satellites, a warm plasma cloak makes up part of the magnetosphere — the invisible shield that surrounds and protects Earth from the onslaught of the solar wind.

A team of scientists headed by Charles “Rick” Chappell, research professor of physics and director of the Dyer Observatory at Vanderbilt University, conducted the study. The team based its conclusion on measurements from five satellites.

The northern and southern polar lights — aurora borealis and aurora australis — are the only parts of the magnetosphere that are visible, but it is a critical part of Earth’s space environment.

“Although it is invisible, the magnetosphere has an impact on our everyday life,” Chappell said. “For example, solar storms agitate the magnetosphere in ways that can induce power surges in the electrical grid that trigger black outs, interfere with radio transmissions, and mess up GPS signals. Charged particles in the magnetosphere can also damage the electronics in satellites and affect the temperature and motion of the upper atmosphere.”

The other regions of the magnetosphere have been known for some time. Chappell and his colleagues pieced together a “natural cycle of energization” that accelerates the low-energy ions that originate from Earth’s atmosphere up to the higher energy levels characteristic of the different regions in the magnetosphere. This brought the existence of the new region into focus.

The warm plasma cloak is a tenuous region that starts on the night side of the planet, wraps around the dayside, and then gradually fades away on the afternoon side. As a result, it only reaches about three-quarters of the way around the planet. It is fed by low-energy charged particles that are lifted into space over Earth’s poles, carried behind Earth in its magnetic tail, and then turned around 180° by a kink in the magnetic fields that boosts the particles back toward Earth in a region called the plasma sheet.

Chappell and his colleagues — Mathew M. Huddleston from Trevecca University, Tom Moore and Barbara Giles from NASA, and Dominique Delcourt from the Centre d’etude des Environments Terrestre et Planetaires, Observatoire de Saint-Maur in France — used satellite observations to measure the properties of the ions in different locations in the magnetosphere.

An important part of their analysis was a computer program developed by Delcourt that can predict how ions move in Earth’s magnetic field. “These motions are very complicated. Ions spiral around in the magnetic field. They bounce and drift. A lot of things can happen,” said Chappell.

When the researchers applied this computer code to the satellite observations, some patterns became clear for the first time. One was the prediction of how ions could move upward from the ionosphere to form the warm plasma cloak.

“We have recognized all the other regions for a long time, but the plasma cloak was a fuzzy thing in the background which we didn’t have enough information about to make it stand out. When we got enough pieces, there it was!” said Chappell.

Close-up view of Einstein Cross

Einstein Cross
Einstein Cross
ESO, F. Courbin et al.
December 15, 2008
Combining a double natural “magnifying glass” with the power of European Southern Observatory’s (ESO) Very Large Telescope (VLT), astronomers have scrutinized the inner parts of the disk around a super-massive black hole 10 billion light-years away. They were able to study the disk with a level of detail a thousand times better than that of the best telescopes in the world, providing the first observational confirmation of the prevalent theoretical models of such disks.

The team of astronomers from Europe and the United States studied the “Einstein Cross,” a famous cosmic mirage. This cross-shaped configuration consists of four images of a distant source. The multiple images are a result of gravitational lensing by a foreground galaxy, an effect that was predicted by Albert Einstein as a consequence of his theory of general relativity. The light source in the Einstein Cross is a quasar approximately 10 billion light-years away, whereas the foreground-lensing galaxy is 10 times closer. The lensing galaxy’s gravitational field bends and magnifies the quasar’s light.
This magnification effect, known as “microlensing,” in which a galaxy plays the role of a cosmic magnifying glass or a natural telescope, proves useful in astronomy as it allows us to observe distant objects that would otherwise be too faint to explore using currently available telescopes. “The combination of this natural magnification with the use of a big telescope provides us with the sharpest details ever obtained,” said Frederic Courbin, leader of the program studying the Einstein Cross with ESO’s VLT

In addition to macrolensing by the galaxy, stars in the lensing galaxy act as secondary lenses to produce an additional magnification. This secondary magnification is based on the same principle as macrolensing, but on a smaller scale, and because stars are much smaller than galaxies, it is known as “microlensing.” As the stars are moving in the lensing galaxy, the microlensing magnification also changes with time. From Earth, the brightness of the quasar images (four in the case of the Einstein Cross) flickers around a mean value, due to microlensing. The size of the area magnified by the moving stars is a few light-days, or comparable in size to the quasar’s accretion disk.

Microlensing affects various emission regions of the disk in different ways, with smaller regions being more magnified. Because differently sized regions have different colors (or temperatures), the net effect of the microlensing is to produce color variations in the quasar images, in addition to the brightness variations. By observing these variations in detail for several years, astronomers can measure how matter and energy are distributed about the super-massive black hole that lurks inside the quasar. Astronomers observed the Einstein Cross three times per month during a period of 3 years using the VLT, monitoring all the brightness and color changes of the four images.

“Thanks to this unique dataset, we could show that the most energetic radiation is emitted in the central light-day away from the super-massive black hole and, more importantly, that the energy decreases with distance to the black hole almost exactly in the way predicted by theory,” said Alexander Eigenbrod, who completed the analysis of the data.

The use of the macro and microlensing, coupled with the giant eye of the VLT, enabled astronomers to probe regions on scales as small as a millionth of an arcsecond. This corresponds to the size of a quarter seen at a distance of 3.1 million miles (5 million kilometers), i.e., about 13 times the distance to the Moon. “This is 1,000 times better than can be achieved using normal techniques with any existing telescope,” said Courbin.

Measuring the way the temperature is distributed around the central black hole is a unique achievement. Various theories exist for the formation and fuelling of quasars, each of which predicts a different profile. So far, no direct and model-independent observation has allowed scientists to validate or invalidate any of these existing theories, particularly for the central regions of the quasar. “This is the first accurate and direct measurement of the size of a quasar accretion disk with wavelength (color), independent of any model,” said team member Georges Meylan.

A gem of a meteor shower

Tools to help you observe the Geminids
StarDome
Astronomy.com’s interactive star chart, StarDome, displays an accurate map of your sky. It’ll help you locate this spectacle. Astronomy magazine subscribers have access to a slew of cool functions with StarDome PLUS.

Video
Enjoying a meteor shower requires only comfort and patience. Senior Editor Michael E. Bakich gives tips on spending a night under “shooting stars.” Watch the video “How to observe meteor showers”.


December 11, 2008
One of the year’s most prolific meteor showers makes its appearance in mid-December. The Geminid shower peaks the night of December 13/14. Although frequently considered a poor cousin to August’s Perseid shower, the Geminids often put on a better show. In a good year, observers can expect to see more than 60 “shooting stars” per hour — an average of better than one per minute — at the Geminids’ peak.

Unfortunately, 2008 isn’t the best year for the Geminids. The Moon reaches its full phase December 12 and won’t appear much different the following night. With bright moonlight in the sky essentially from dusk to dawn, fainter meteors will be washed out, and only the bright ones will shine through. Under clear skies, attentive observers should see 10 to 15 meteors per hour — not great, but better than all but a handful of nights during 2008.

One way to compensate for the Moon’s presence is to find a spot where a building or tree blocks the Moon from view. This will make the sky appear darker. Also, try to observe from a rural location, where city lights won’t add to the Moon’s glow. Because December nights tend to be cold, bundle up in layers if you plan to view the Geminids. Reclining in a lawn chair is a great way to take in a lot of the sky at once, but be sure to get up and walk around occasionally. It also helps to drink some hot coffee or tea.

The Geminids begin as tiny specks of dust that hit Earth’s atmosphere at 81,000 mph (130,000 km/h), vaporizing from friction with the air and leaving behind the streaks of light we call meteors. The meteors appear to emanate from the constellation Gemini the Twins (hence their name), near the bright stars Castor and Pollux. You can find this area in the eastern sky during the early evening hours and nearly overhead after midnight.


Happy birthday to Mount Wilson’s historic telescope

60-inch telescope at Mount Wilson Observatory
On December 13, 1908, astronomers first gazed at the heavens with the 60-inch telescope at Mount Wilson Observatory in California. It was the most technologically advanced viewing instrument of its age. Credit: MWO
Mount Wilson Observatory
Hale brothers look through Mount Wilson 60-inch telescope
Brothers Sam (left) and Brack Hale look through the historic 60-inch telescope founded 100 years earlier by their grandfather, pioneer astronomer George Ellery Hale.
Courtesy Craig T. Mathew/Mathew Imaging
December 12, 2008
Mount Wilson Observatory (MWO) marked an important anniversary December 13. It has been 100 years since pioneer astronomer George Ellery Hale first gazed at the heavens through the observatory’s historic 60-inch reflecting telescope.

The 60-inch was Earth’s largest telescope at the time it was built. Creating its 1,900-pound mirror was a technological triumph. It established a new standard for large, precision-controlled reflecting telescopes.

The 60-inch established MWO as a leader in astronomical discoveries in the early 20th century. For example, Harlow Shapley used it to discover that our Sun was not the center of the universe, and that our galaxy is far larger than anyone imagined.

MWO’s current director, Harold McAlister, says the anniversary is an occasion to look backward as well as forward. “The centennial naturally brings the telescope’s technological and scientific greatness to the front of my mind,” he says. “This event makes me even more determined that a second century be assured for Mount Wilson, which truly is a world-class science heritage site.”


Related blog: Senior Editor Daniel Pendick spoke with McAlister about the 60-inch telescope’s place in astronomical history and its current scientific activities. Read “Happy birthday to a grand old telescope.”


MWO’s 100-inch Hooker Telescope is still used for research. And the 60-inch remains the largest telescope in the world made exclusively available for public viewing. Read about the observatory’s public programs and efforts to preserve the site and its instruments at the MWO web site.

Mars orbiter completes primary mission

Mars Reconnaissance Orbiter
Artist’s concept of the Mars Reconnaissance Orbiter.
NASA/JPL
December 12, 2008
NASA’s Mars Reconnaissance Orbiter (MRO) has completed its primary, 2-year science phase. The spacecraft found signs of a complex martian history of climate change that produced a diversity of past watery environments.

The orbiter returned 73 terabits of science data, more than all earlier Mars missions combined. The spacecraft will build on this record as it continues to examine Mars in unprecedented detail during its next 2-year phase of science operations.

Among the major findings during the primary science phase is the revelation that the action of water on and near the surface of Mars occurred for hundreds of millions of years. This activity was at least regional and possibly global in extent, though possibly intermittent. The spacecraft also observed that signatures of a variety of watery environments, some acidic, some alkaline, increasing the possibility that there are places on Mars that could reveal evidence of past life, if it ever existed.

Since moving into position 186 miles (299 kilometers) above Mars’ surface in October 2006, the orbiter also has conducted 10,000 targeted observation sequences of high-priority areas. It has imaged nearly 40 percent of the planet at a resolution that can reveal house-sized objects in detail and 1 percent in enough detail to see desk-sized features. This survey has covered almost 60 percent of Mars in mineral mapping bands at stadium-size resolution. The orbiter also assembled nearly 700 daily global weather maps, dozens of atmospheric temperature profiles, and hundreds of radar profiles of the subsurface and the interior of the polar caps.

“These observations are now at the level of detail necessary to test hypotheses about when and where water has changed Mars and where future missions will be most productive as they search for habitable regions on Mars,” said Richard Zurek, Mars Reconnaissance Orbiter project scientist at NASA’s Jet Propulsion Laboratory (JPL) in Pasadena, California.

Included in the observations are hundreds of stereo pairs used to make detailed topography maps and classic images in support of other Mars missions. One image showed the Mars rover Opportunity poised on the rim of Victoria Crater and another of NASA’s Phoenix Mars Lander during its descent to the surface. MRO data prompted the Phoenix team to change the spacecraft’s landing site. MRO data is also being used to select the landing location for NASA’s Mars Science Laboratory, which is scheduled for launch in 2011. For 5 months of Phoenix operations on Mars that ended in November, MRO and NASA’s Mars Odyssey orbiter shared the responsibility of relaying commands to the lander and data from Phoenix back to Earth.

The MRO also found repetitive layering in Mars’ permanent polar ice caps. The patterns suggest climate-change cycles continuing to the present. They may record possible effects of cyclical changes in Mars’ tilt and orbit on global sunlight patterns. Recent climate cycles are indicated by radar detection of subsurface icy deposits outside the polar regions, closer to the equator, where near-surface ice is not permanently stable. Other results reveal details of ancient streambeds, atmospheric hazes, and motions of water, along with the ever-changing weather on Mars.

Most observations from the orbiter will be discontinued for a few weeks while the Sun is between Earth and Mars, which will disrupt communications. Later this month, the orbiter will begin a new phase, with science observations continuing as Mars makes another orbit around the Sun, which takes approximately 2 Earth years.

“This spacecraft truly exemplifies the best in capabilities to support science and other martian spacecraft activities,” said Michael Meyer, lead scientist for the Mars Exploration Program at NASA headquarters in Washington. “MRO has exceeded its own goals and our expectations. We look forward to more discoveries as we continue to look at the Red Planet in spectacular detail.”

Groundwater springs helped shape Mars

Light Toned Deposits on Mars
Iani Chaos on Mars, an area where Light Toned Deposits, or LTD, are known to be present.
ESA/DLR/FU Berlin (G. Neukum)
December 12, 2008
Data and images from Mars Express suggest that several Light Toned Deposits (LTDs), some of the least understood features on Mars, were formed when large amounts of groundwater burst onto the surface. Scientists propose that groundwater had a greater role in shaping the martian surface than previously believed, and may have sheltered primitive life forms as the planet started drying up.

LTDs — martian sediments that most closely resemble sediments on Earth — are some of the most mysterious sediments on Mars. Causes for their origin remain unknown. Until now, different mechanisms, including volcanic processes, have been proposed for their formation.

LTDs were first discovered by the Viking spacecraft in the late 1970s and since have been at the center of scientific debate. These deposits occur on a large scale in Arabia Terra, Chaotic Terrain, and Valles Marineris, close to the Tharsis volcanic bulge. Now, based on Mars Express data, scientists propose that these sediments are actually younger than originally believed. Angelo P. Rossi and colleagues (ESA) report their findings in a paper published in September 2008. They propose that several LTDs may have been deposited by large-scale springs of groundwater that burst onto the surface, possibly at different times.

Analysis indicates that groundwater had a more wide-ranging and important role in martian history than previously believed. Hydrated minerals, relatively young in age, have been found in the region. Given that the deposits are relatively young in age, and associated with water, they may also have sheltered microbial life from the drier and harsher climate in more recent times on Mars, possibly eliminating the need for a stable atmosphere or a permanent water body.

New detector design enhances exoplanet studies

WASP-10b illustration
When the planet WASP-10b crosses the disk of its star, WASP-10, the brightness of the star decreases, allowing scientists to measure the precise size of the planet.
John Johnson
December 11, 2008
A team of astronomers led by John Johnson of the University of Hawaii’s Institute for Astronomy (UH) has used a new technique to measure the precise size of a planet orbiting a distant star. The team used a camera so sensitive that it could detect the passage of a moth in front of a lit window from a distance of 1,000 miles.

The camera, mounted on UH’s 2.2-meter telescope on Mauna Kea, measures the small decrease in brightness that occurs when a planet passes in front of its star along the line-of-sight from Earth. These “planet transits” allow researchers to measure the diameters of worlds outside our solar system.

“While we know of more than 330 planets orbiting other stars in our Milky Way galaxy, we can measure the physical sizes of only the few that line up just right to transit,” said Johnson. The team studied a planet called WASP-10b, which was thought to have an unusually large diameter. They measured its diameter with higher precision than before, and they found it is one of the densest planets known, rather than one of the most bloated. The planet orbits the star WASP-10, which is about 300 light-years from Earth.

Institute for Astronomy (IfA) astronomer John Tonry designed the camera, known as Orthogonal Parallel Transfer Imaging Camera (OPTIC), and it was built at the IfA. It uses a new type of detector, an orthogonal transfer array, which is the same type used in the Pan-STARRS 1.4 Gigapixel Camera, the largest digital camera in the world. These detectors are similar to the CCDs (charge-coupled devices) commonly used in scientific and consumer digital cameras, but they are more stable and can collect more light, which leads to higher precision.

“This new detector design is going to change the way we study planets. It’s the killer app for planet transits,” said team member Joshua Winn of Massachusetts Institute of Technology (MIT). The precision of the camera is high enough to detect transits of much smaller planets than previously possible. It measures light to a precision of one part in 2,000. For the first time, scientists are approaching the precision needed to measure transits of Earth-size planets.

Bigger planets block more of the star’s surface and cause a deeper brightness dip. The diameter of WASP-10b is only 6 percent larger than that of Jupiter, even though WASP-10b is three times more massive. Correspondingly, its density is about three times higher than Jupiter’s. Because their interiors become partially degenerate, Jovian planets have a nearly constant radius across a wide range of masses.

The photometric precision is three to four times higher than that of typical CCDs and two to three times higher than the best CCDs, and comparable to the most recent results from the Hubble Space Telescope for stars of the same brightness.

James Webb Telescope mirrors chill out

JWST illustration
Artist’s rendition of the James Webb Space Telescope.
NASA
December 11, 2008
The first of 18 mirror segments that will fly on NASA’s James Webb Space Telescope arrived this week at the Marshall Space Flight Center, Huntsville, Alabama, to begin preparations to meet the extreme temperatures it will encounter in space.

The X-ray & Cryogenic Facility (XRCF) at the Marshall Center is the world’s largest X-ray telescope test site and a unique, cryogenic, clean room optical test center. Cryogenic testing will take place in a 7,600 cubic foot helium-cooled vacuum chamber, chilling the Webb flight mirror from room temperature to frigid -414° Fahrenheit (-248° Celsius). While the mirrors change temperature, test engineers will measure their structural stability to ensure they will perform as designed once they are operating in space.

“Optical measurements of the 18 mirror segments at cold temperatures will be made and used to create mirrors that will focus crisply in space,” said Helen Cole, project manager for Webb Telescope mirror activities at XRCF. “This will allow us to see new wonders in our universe.”

NASA’s James Webb Space Telescope is a large, infrared-optimized space telescope that will be the premier observatory of the next decade. It will study every phase in the history of our universe, ranging from the first luminous glows after the Big Bang, to the formation of solar systems capable of supporting life on planets like Earth, to the evolution of our own solar system. Its instruments will work primarily in the infrared range of the electromagnetic spectrum, with some capability in the visible range.

JWST primary mirror
This drawing compares the sizes of the Hubble Space Telescope and James Webb Space Telescope primary mirrors.
NASA
The Webb Telescope will have a large mirror, 21.3 feet (6.5 meters) in diameter, made up of 18 segments about 4.9 feet (1.5 meters) in size. The telescope’s home in space will be about 1 million miles (1,609,344 kilometers) from Earth. The completed primary mirror will be more than 2.5 times larger than the diameter of the Hubble Space Telescope’s primary mirror, which is 7.8 feet (2.4 meters), but will weigh roughly half as much, because it is made of beryllium, one of the lightest applicable metals known to man.

The amount of detail a space telescope can see is directly related to the size of the mirror area that collects light from the universe. A larger area collects more light and can see deeper into space and at a much higher resolution than a smaller mirror. That’s why the telescope’s primary mirror is made up of 18 mirror segments that form a total area of almost 30 square yards (25 square meters) when they all come together.

What’s unique about Webb’s large primary mirror is that each of the 18 mirrors will have the ability to be moved individually, so that they can be aligned together to act as a single large mirror. Scientists and engineers can also correct for imperfections after the telescope opens in space, or if any changes occur in the mirror during the life of the mission. Precision testing, like this test cycle in XRCF, provides detailed measurements to fabricate and deliver a high-resolution mirror.

“Beginning today, we kick off exclusive testing of the James Webb Space Telescope mirrors which will run though 2011. Our one-of-a-kind facility can provide the environment which allows us to optically measure infinitesimally small changes in the mirrors as they cool,” said Jeff Kegley, XRCF testing manager.

Unprecedented look at our galaxy’s heart

Milky Way
Center of the Milky Way.
ESO/S. Gillessen et al
December 10, 2008
In a study using several of European Southern Observatory’s (ESO) flagship telescopes, a team of German astronomers has produced the most detailed view of the surroundings of our galaxy’s heart — a super-massive black hole. The research has unraveled the hidden secrets of this tumultuous region by mapping the orbits of almost 30 stars, a five-fold increase over previous studies. One of the stars has now completed a full orbit around the black hole.


In a blog post, “The Milky Way’s center of attention,” Astronomy magazine Associate Editor Daniel Pendick explains why these results make scientists — and him — so happy.


Astronomers have studies the super-massive black hole by watching the motions of 28 stars orbiting the Milky Way’s most central region, Sagittarius A. The new research marks the first time astronomers have calculated the orbits of so many of these central stars precisely. The observations reveal information about the enigmatic formation of these stars — and about the black hole to which they are bound.

“The center of the galaxy is a unique laboratory where we can study the fundamental processes of strong gravity, stellar dynamics, and star formation that are of great relevance to all other galactic nuclei, with a level of detail that will never be possible beyond our galaxy,” said Reinhard Genzel, leader of the team from the Max-Planck-Institute for Extraterrestrial Physics in Garching near Munich, Germany.

The interstellar dust that fills the galaxy blocks our direct view of the Milky Way’s central region in visible light. So astronomers used infrared wavelengths that can penetrate the dust to probe the region. While this is a technological challenge, it is well worth the effort. “The galactic center harbors the closest super-massive black hole known. Hence, it is the best place to study black holes in detail,” said Stefan Gillessen, the study’s first author.

The team used the central stars as “test particles” by watching how they move around Sagittarius A. Tracking the central stars shows the nexus of forces at work at the galactic center. These observations can then be used to infer important properties of the black hole itself, such as its mass and distance. The new study also shows that at least 95 percent of the mass sensed by the stars has to be in the black hole. There is little room left for other dark matter.

“Undoubtedly the most spectacular aspect of our long-term study is that it has delivered what is now considered to be the best empirical evidence that super-massive black holes do really exist. The stellar orbits in the galactic center show that the central mass concentration of four million solar masses must be a black hole beyond any reasonable doubt,” said Genzel. The observations also allow astronomers to pinpoint our distance to the galactic center with great precision, which is now measured to be 27,000 light-years.

To build this unparalleled picture of the Milky Way’s heart and calculate the orbits of the individual stars the team had to study these stars for many years. These latest groundbreaking results represent 16 years of work that started with observations made in 1992 with the System for High Angular Resolution Pictures (SHARP) camera attached to ESO’s 3.5-meter New Technology Telescope located at the La Silla Paranal Observatory in Chile. More observations have continued since 2002 using two instruments mounted on ESO’s 8.2-meter Very Large Telescope (VLT).

For the first time, the number of known stellar orbits is now large enough to look for common properties among them. “The stars in the innermost region are in random orbits, like a swarm of bees,” said Gillessen. “However, further out, six of the 28 stars orbit the black hole in a disk. In this respect the new study has also confirmed earlier work in which the disk had been found, but only in a statistical sense. Ordered motion outside the central light-month, randomly oriented orbits inside — that’s how the dynamics of the young stars in the galactic center are best described.”

One particular star, known as S2, orbits the Milky Way’s center so fast that it completed one full revolution within the 16-year period of the study. Observing one complete orbit of S2 contributed to the high accuracy reached and to understanding this region. Yet the mystery still remains as to how these young stars came to be in the orbits they are observed to be in today. They are much too young to have migrated far, but it seems even more improbable that they formed in their current orbits where the tidal forces of the black hole act. Future observations are already being planned to test several theoretical models that try to solve this riddle.

“ESO still has much to look forward to,” said Genzel. “For future studies in the immediate vicinity of the black hole, we need higher angular resolution than is presently possible.”

According to Frank Eisenhauer, principal investigator of the next generation instrument General Relativity Analysis via VLT Interferometry (GRAVITY), ESO will soon be able to obtain that much needed resolution. “The next major advance will be to combine the light from the four 8.2-meter VLT unit telescopes — a technique known as interferometry. This will improve the accuracy of the observations by a factor of 10 to 100 over what is currently possible. This combination has the potential to directly test Einstein’s general relativity in the presently unexplored region close to a black hole.”