Key Takeaways:
Ever wonder where all the active supermassive black holes are in the universe? Now, with the largest quasar catalog yet, you can see the locations of 1.3 million quasars in 3D.
The catalog, Quaia, can be accessed here.
“This quasar catalog is a great example of how productive astronomical projects are,” says David Hogg, study co-author and computational astrophysicist at the Flatiron Institute, in a press release. “Gaia was designed to measure stars in our galaxy, but it also found millions of quasars at the same time, which give us a map of the entire universe.” By mapping and seeing where quasars are across the universe, astrophysicists can learn more about how the universe evolved, insights into how supermassive black holes grow, and even how dark matter clumps together around galaxies. Researchers published the study this week in The Astrophysical Journal.
The brightest beacons
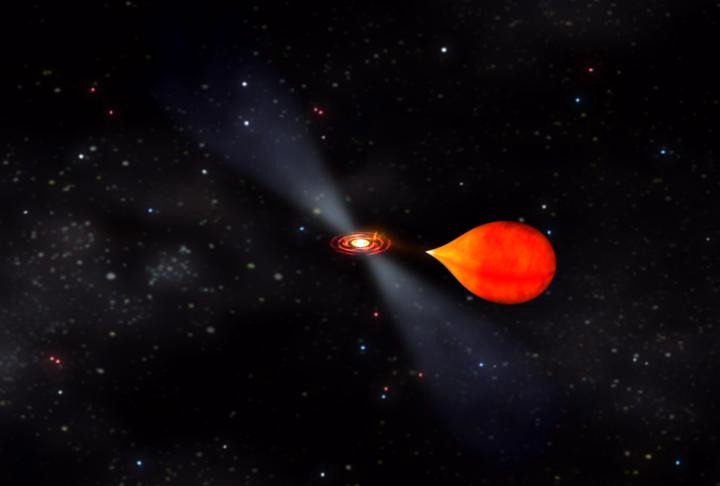
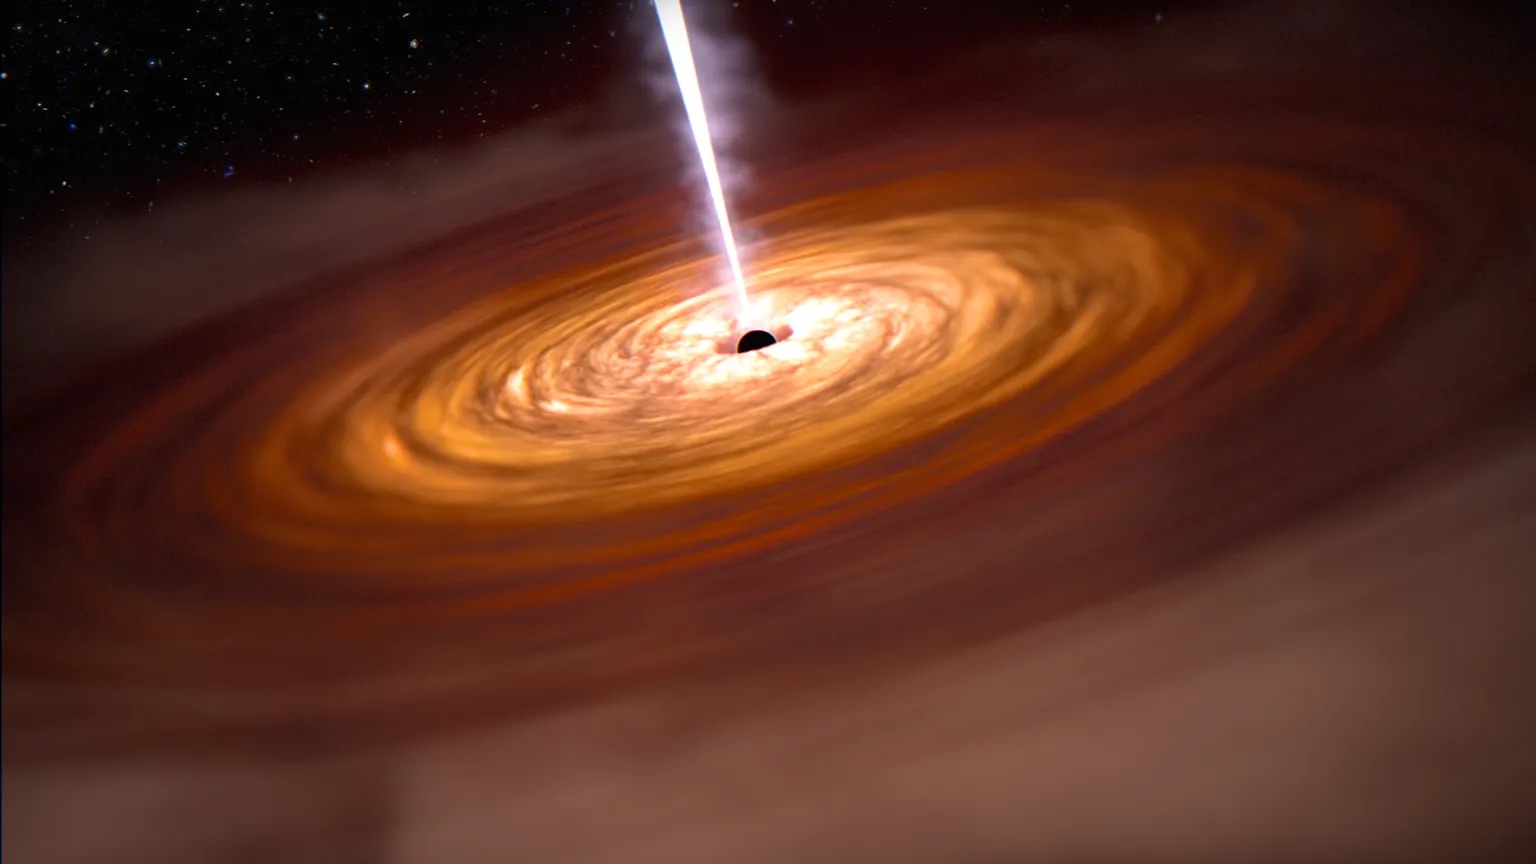
Quasars achieve their brightness from their supermassive black hole at their centers, pulling in the surrounding gas and dust. A great deal of energy is released as much of the material is hyperaccelerated and does not all fall into the black hole’s event horizon. The extreme gravitational pull exerted creates luminous jets of energy we observe from Earth. These brilliant events are some of the most energetic in the universe and produce more light than the Milky Way’s entire population of stars and gas. Quasars are the active centers of young galaxies and most lie at very large distances, so we see them as they were in the early days of the cosmos.
Gaia‘s surveys

Originally, the European Space Agency’s Gaia satellite focused on mapping a 3D map of all the stars in the Milky Way Galaxy. However, later on it targeted galaxies and quasars all across the sky.
To create the log of millions of quasars, the team used data from Gaia’s third data release, NASA’s Wide-Field Infrared Survey and the Sloan Digital Sky Survey. Together, the team sifted through 6.6 million potential quasars and removed contaminating light from other stars and galaxies. Scientists also nailed down each quasar’s distance from the data sets. The new map also shows where dust and other stars could block a quasar from view. Aside from pinpointing each quasar, the catalog is a tool researchers can use to study the structures of each object.
“It has been very exciting to see this catalog spurring so much new science,” says Kate Storey-Fisher, study lead author and an expert in the universe’s large-scale structure at the Donostia International Physics Center. “Researchers around the world are using the quasar map to measure everything from the initial density fluctuations that seeded the cosmic web to the distribution of cosmic voids to the motion of our solar system through the universe.”