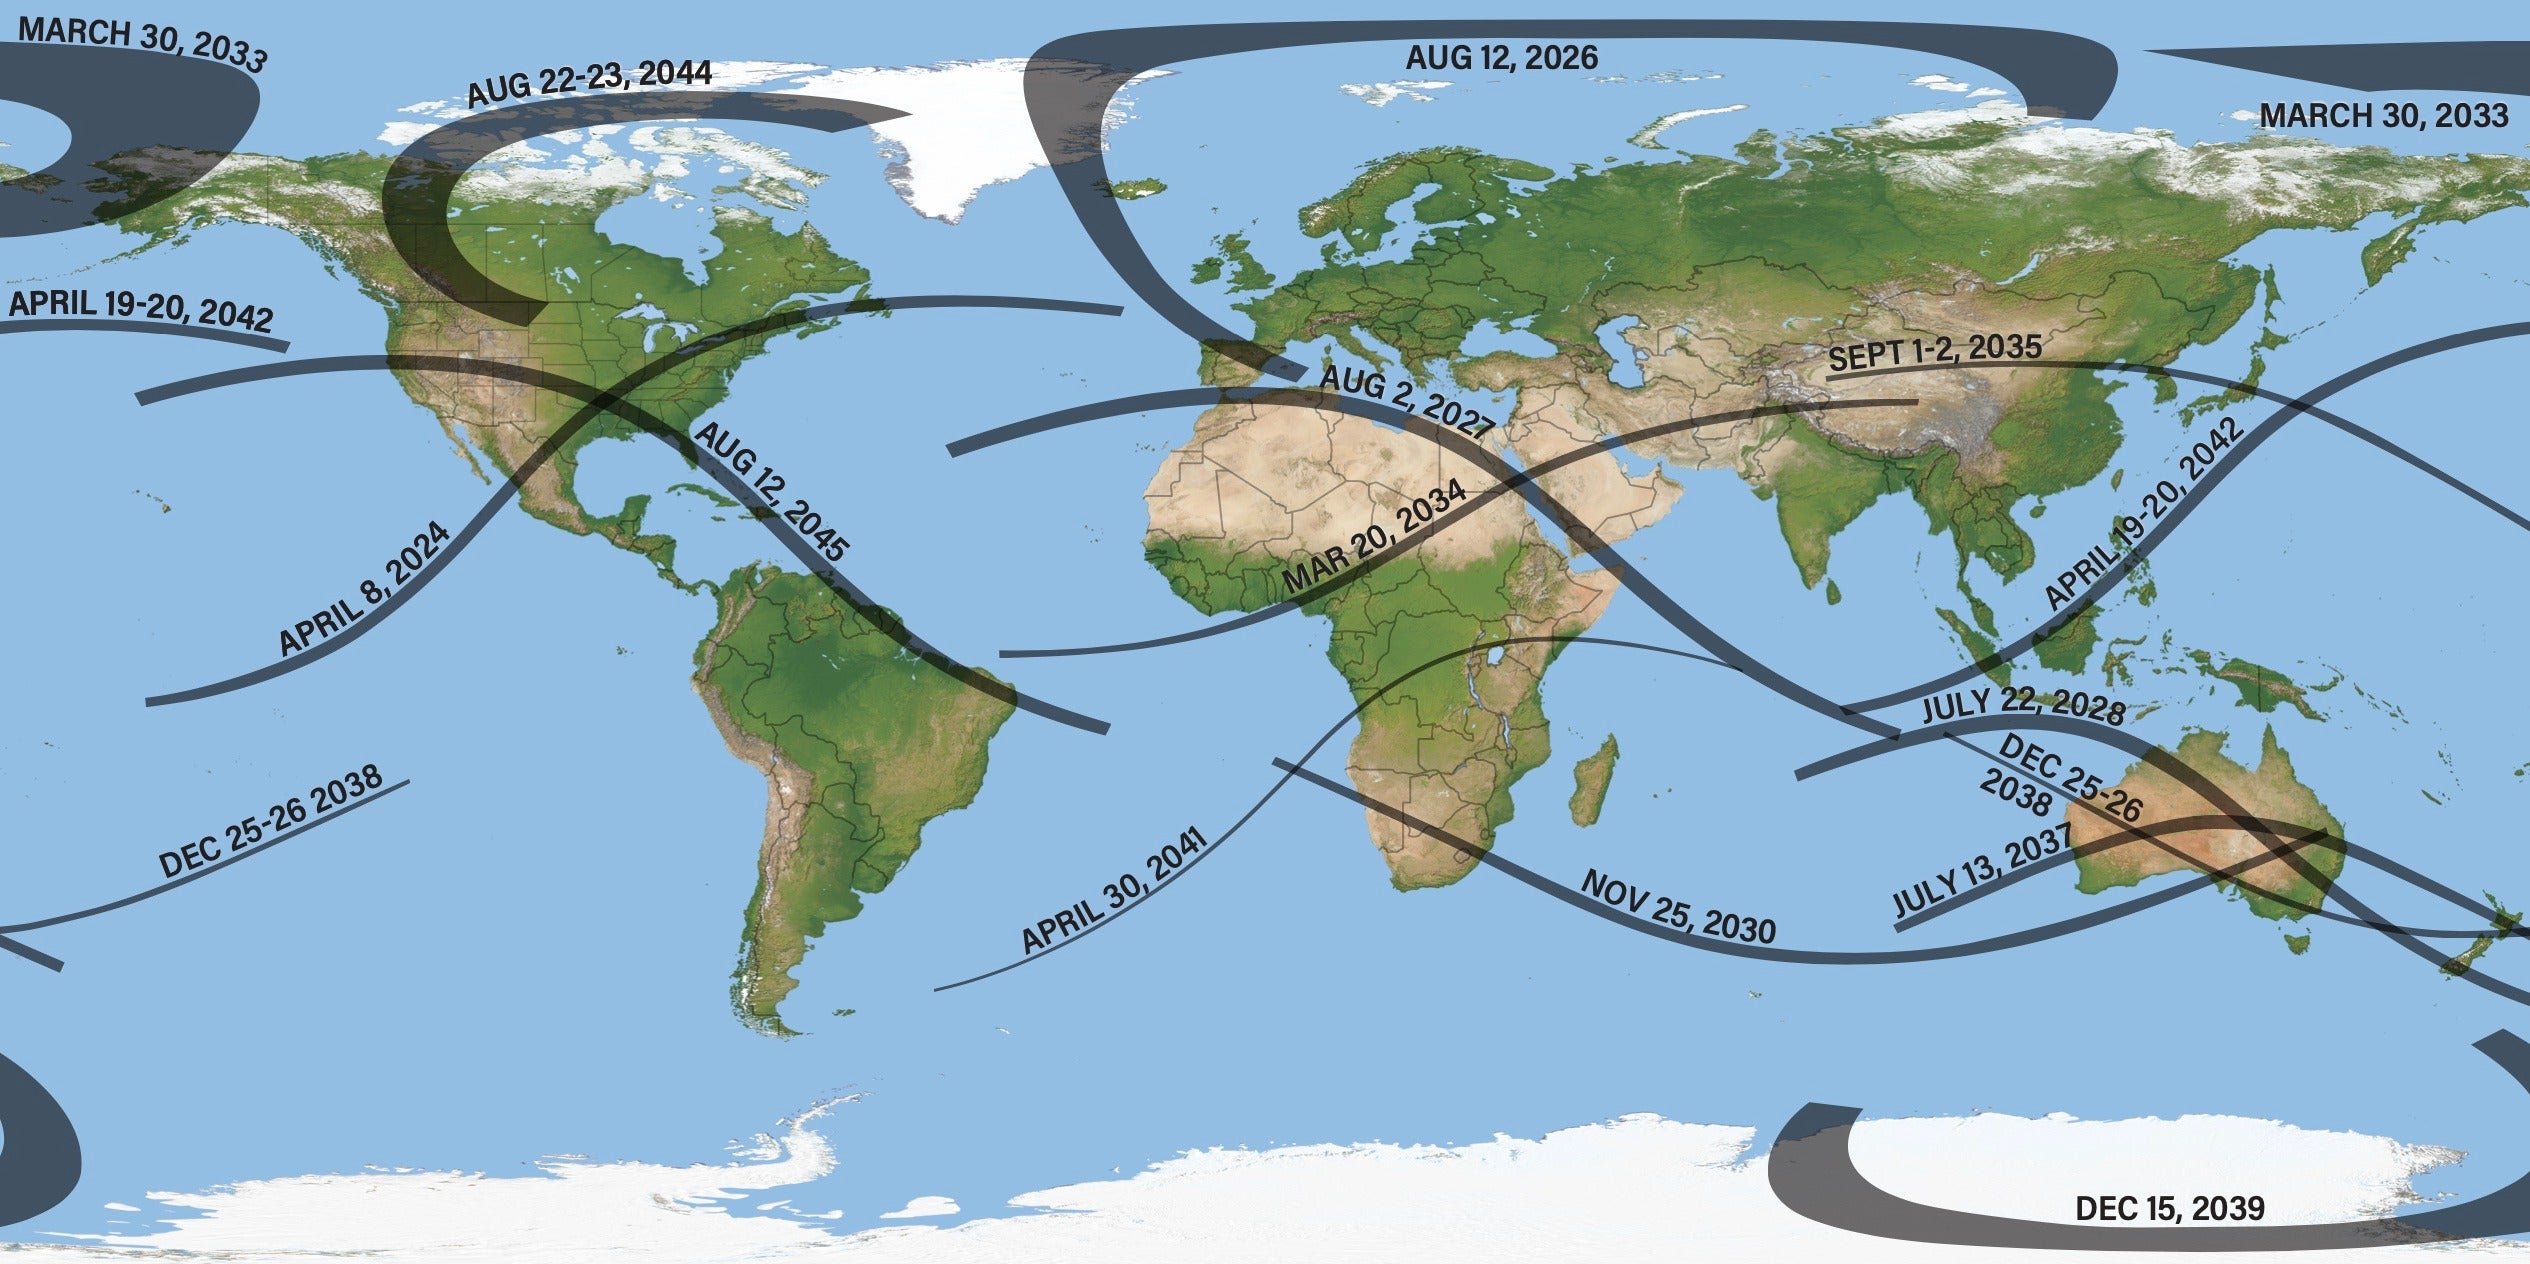
When April 8’s solar eclipse arrives, more than 42 million North Americans living under the path of totality, as well as uncounted millions nearby, will be watching the weather forecast for the prospects of a cloud-free sky. However, those skies could pose a challenge: April is a month that struggles to get out from under the clouds as winter reluctantly gives way to spring.
Useful forecasts can’t be made much more than a week ahead, but satellite-based observations of cloud coverage beginning in 1979 provide climate data that point to the best prospects for sunshine.
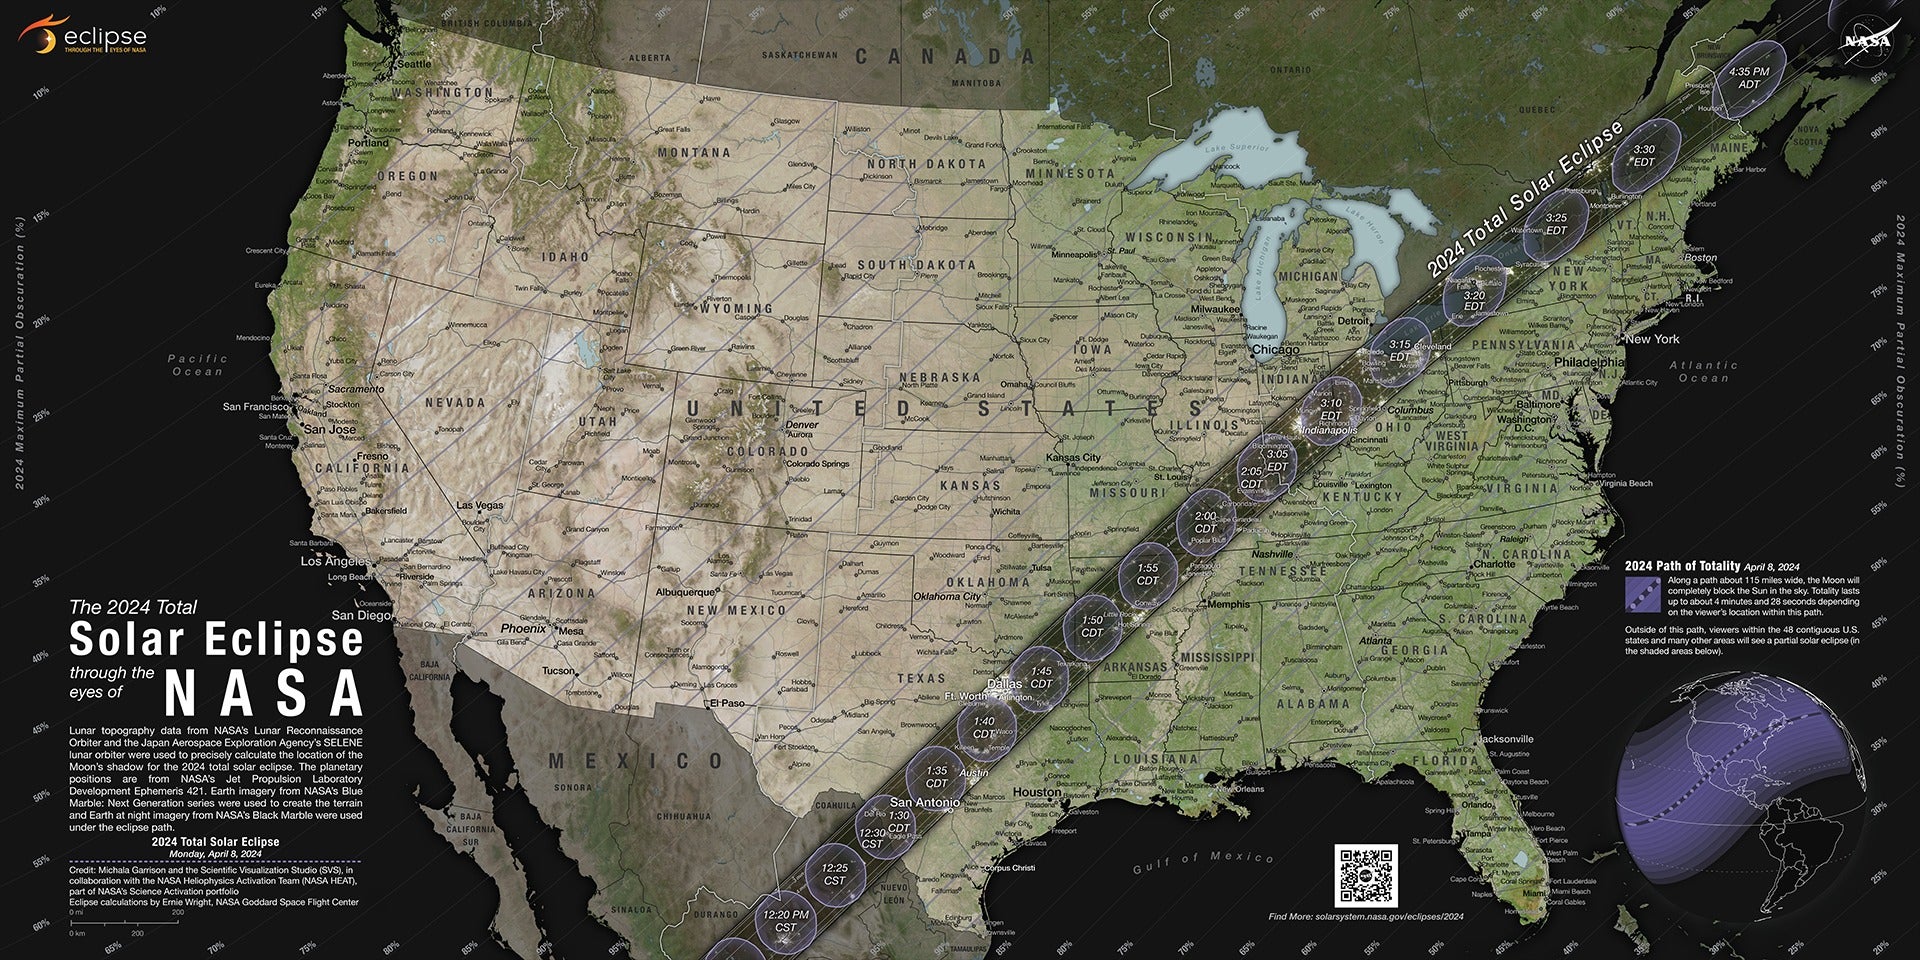
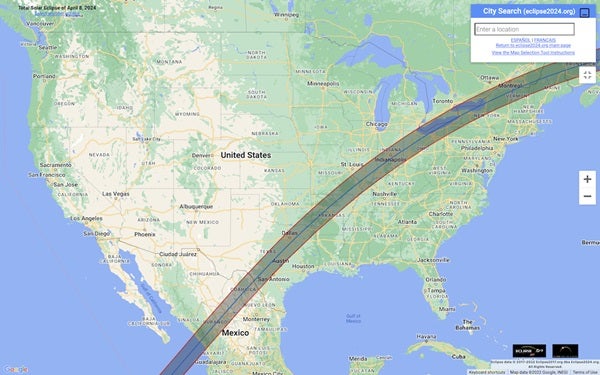
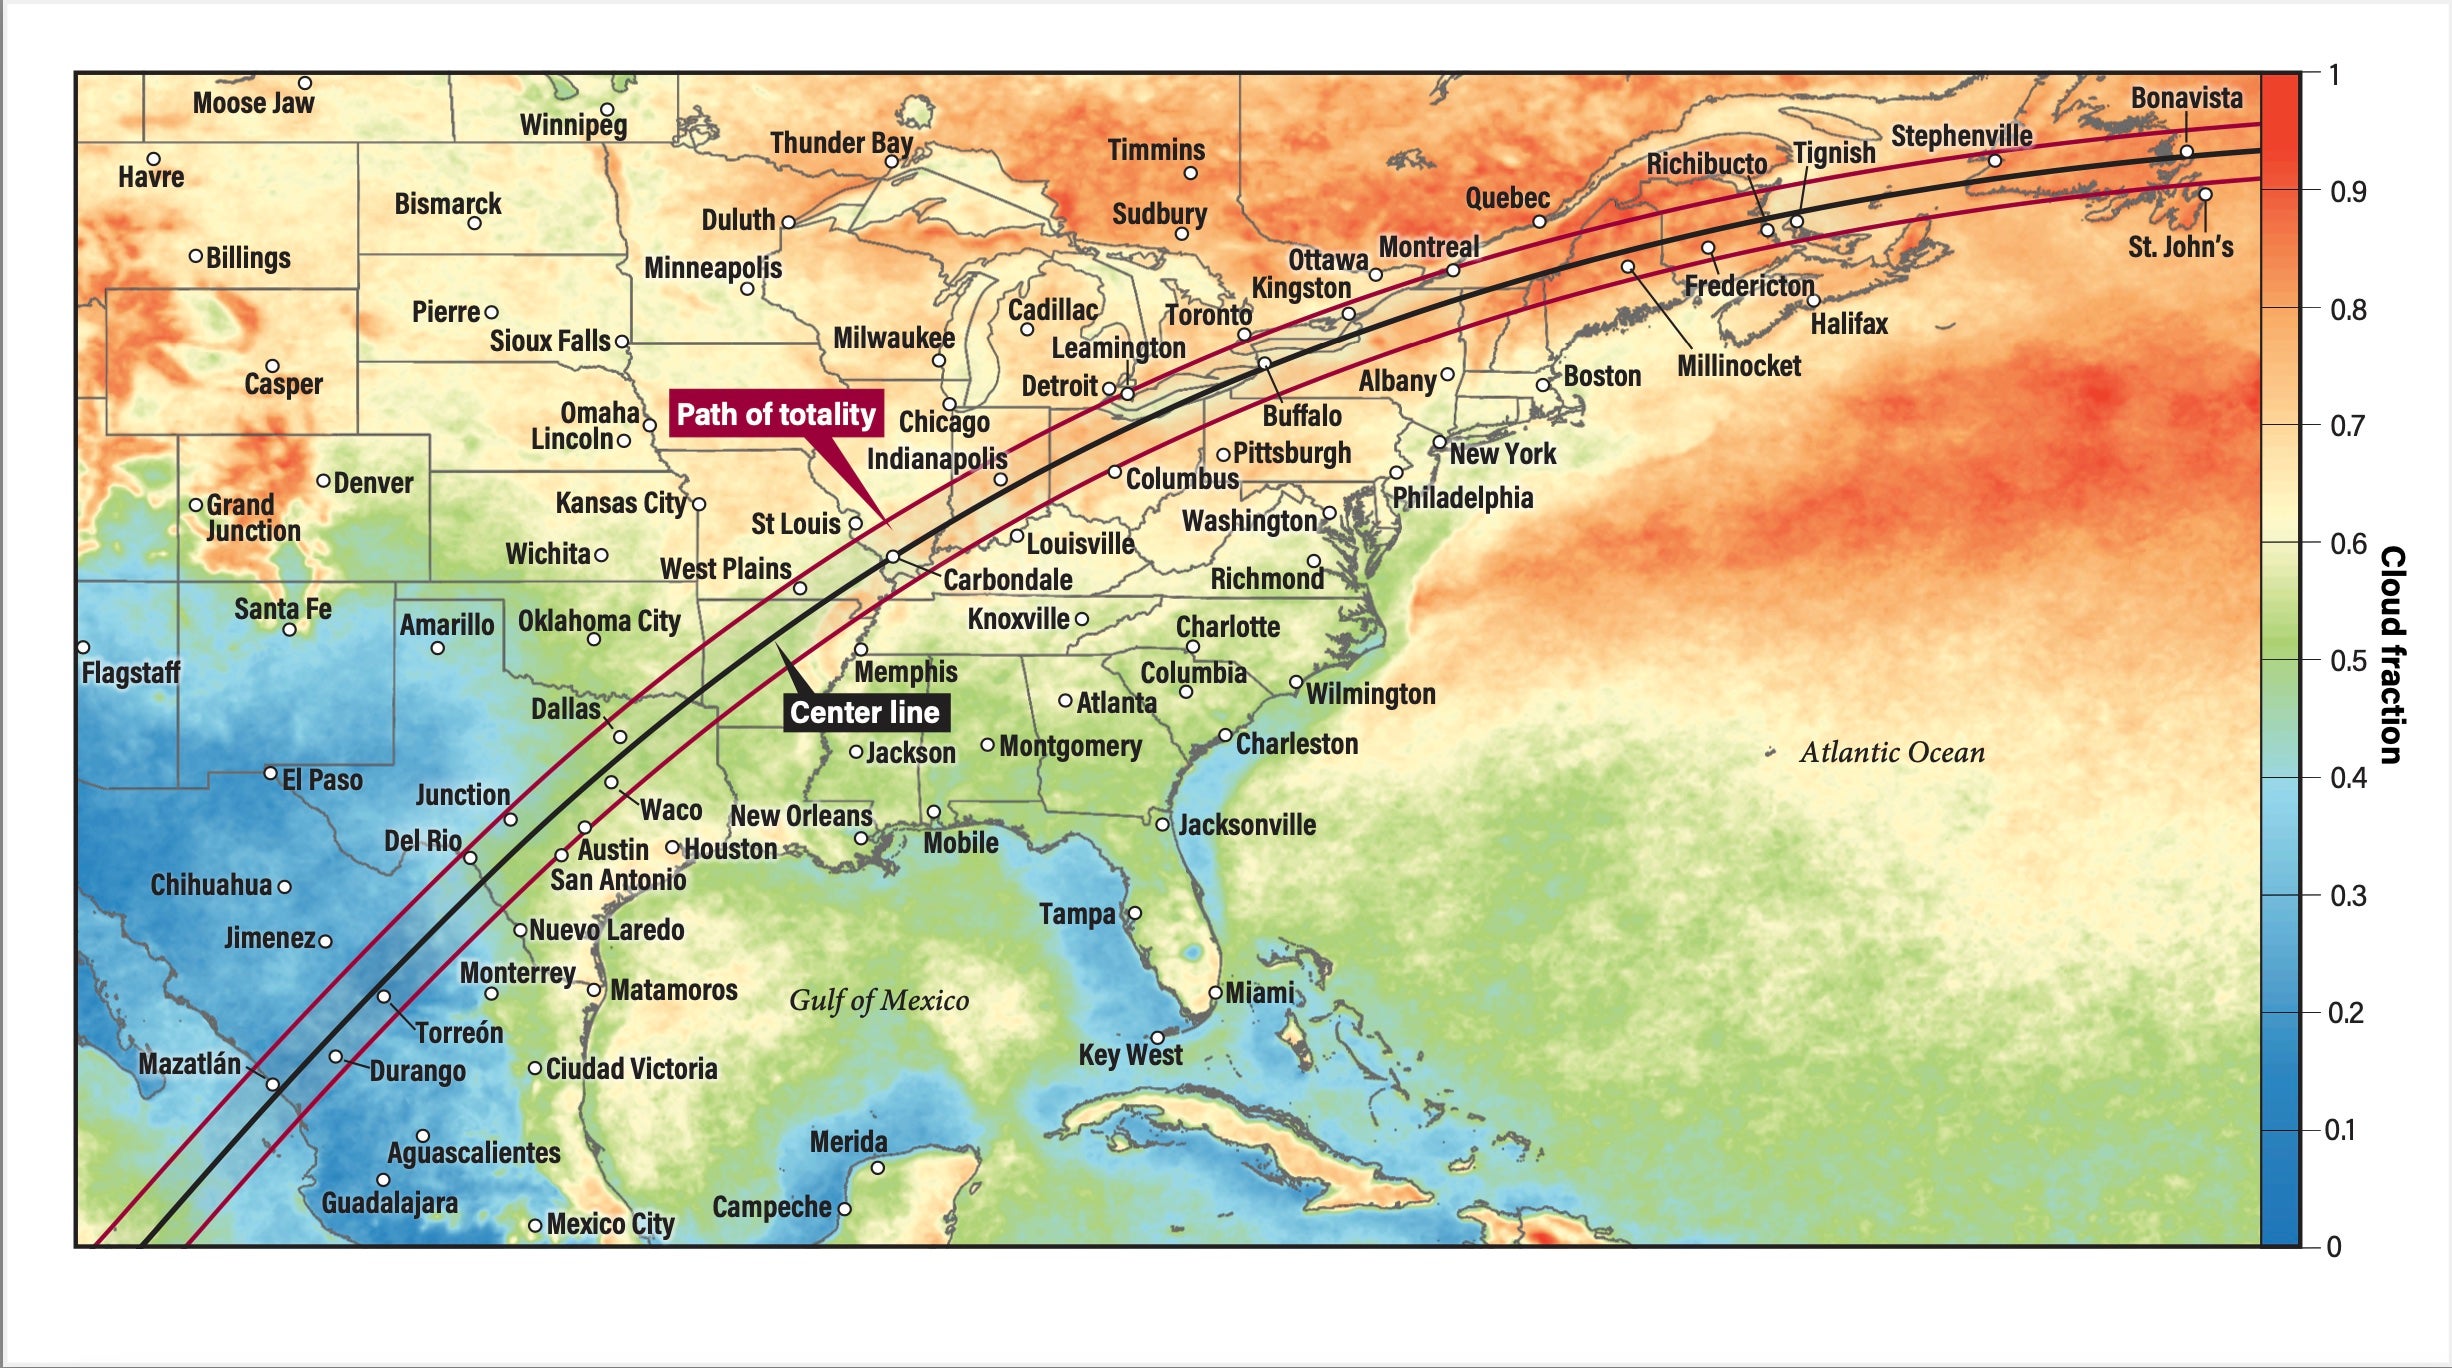
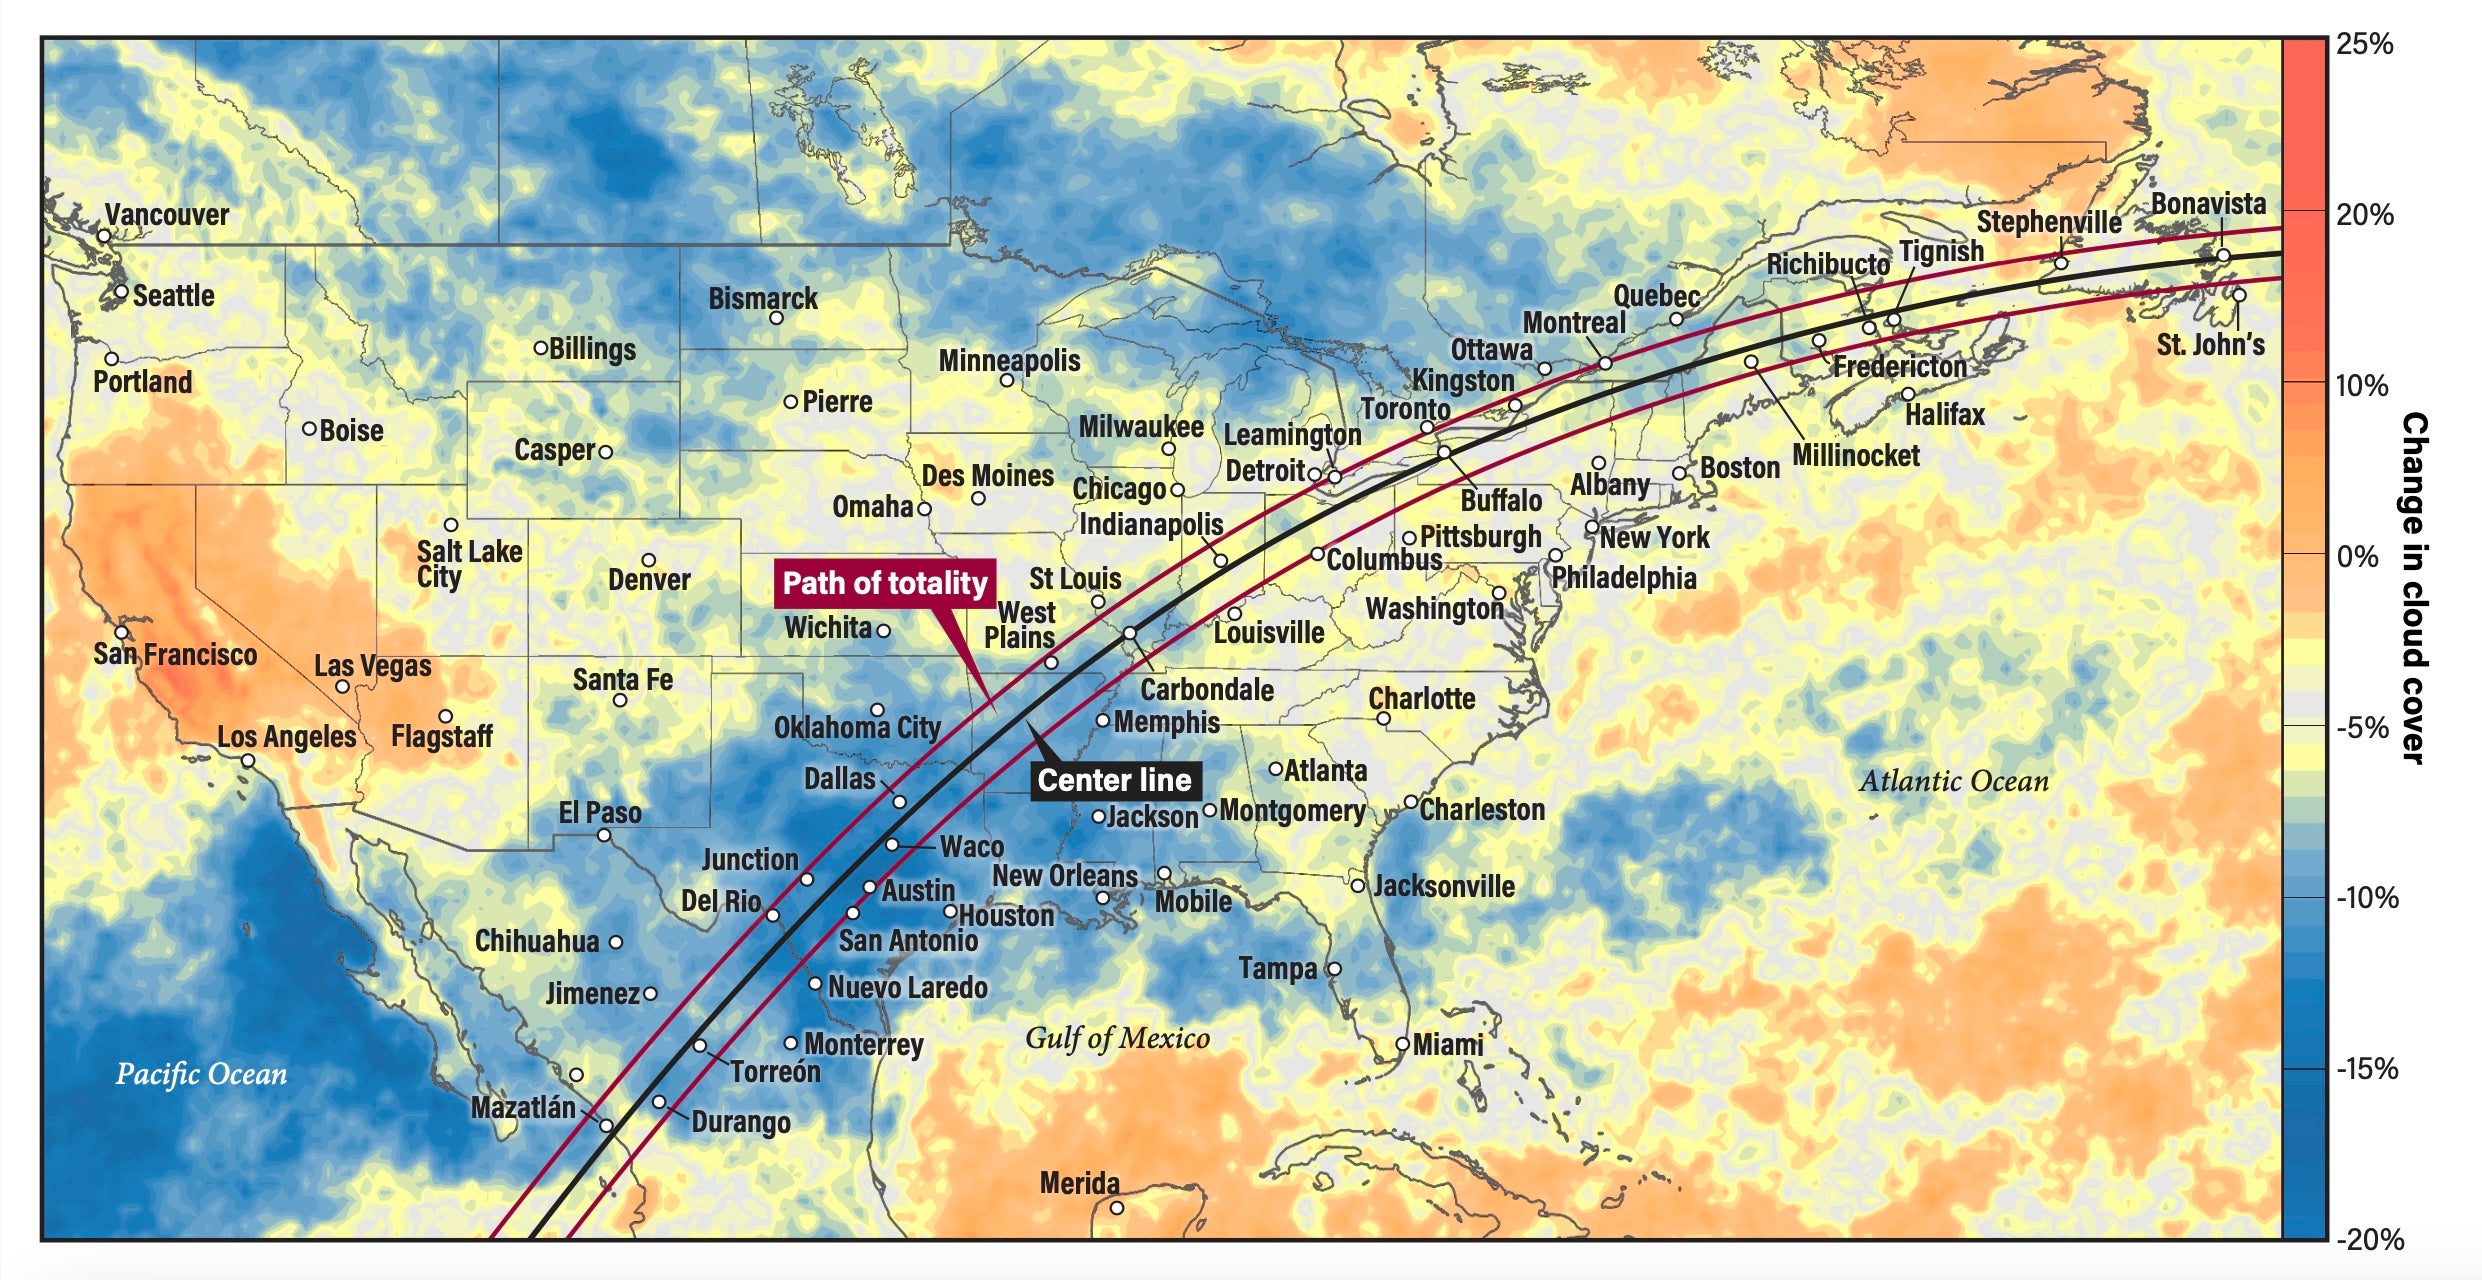
The path of this eclipse spans climates ranging from dry subtropical deserts to snowy spring forests. For the mobile eclipse seeker, the best advice is to go south, where summer weather is most advanced: Mexico and Texas. In April, the average cloud cover along the eclipse track ranges from roughly 20 percent over the Mexican Plateau around Torreón to more than 85 percent in parts of Quebec and in Newfoundland. (Cloud cover, or cloud amount, is the fraction of the sky covered by clouds.) In the U.S., cloud amounts along the center line range from 48 to 58 percent from Texas through Arkansas, Oklahoma, and Missouri before climbing into the 70 and 80 percent range as the track crosses the Great Lakes and moves into Canada and the northeastern U.S. Fortunately, it’s not all gloomy news, as there are oases of sunshine in the northern states and Canada that offer modest promises of clear weather on eclipse day.
The eclipse trek begins!
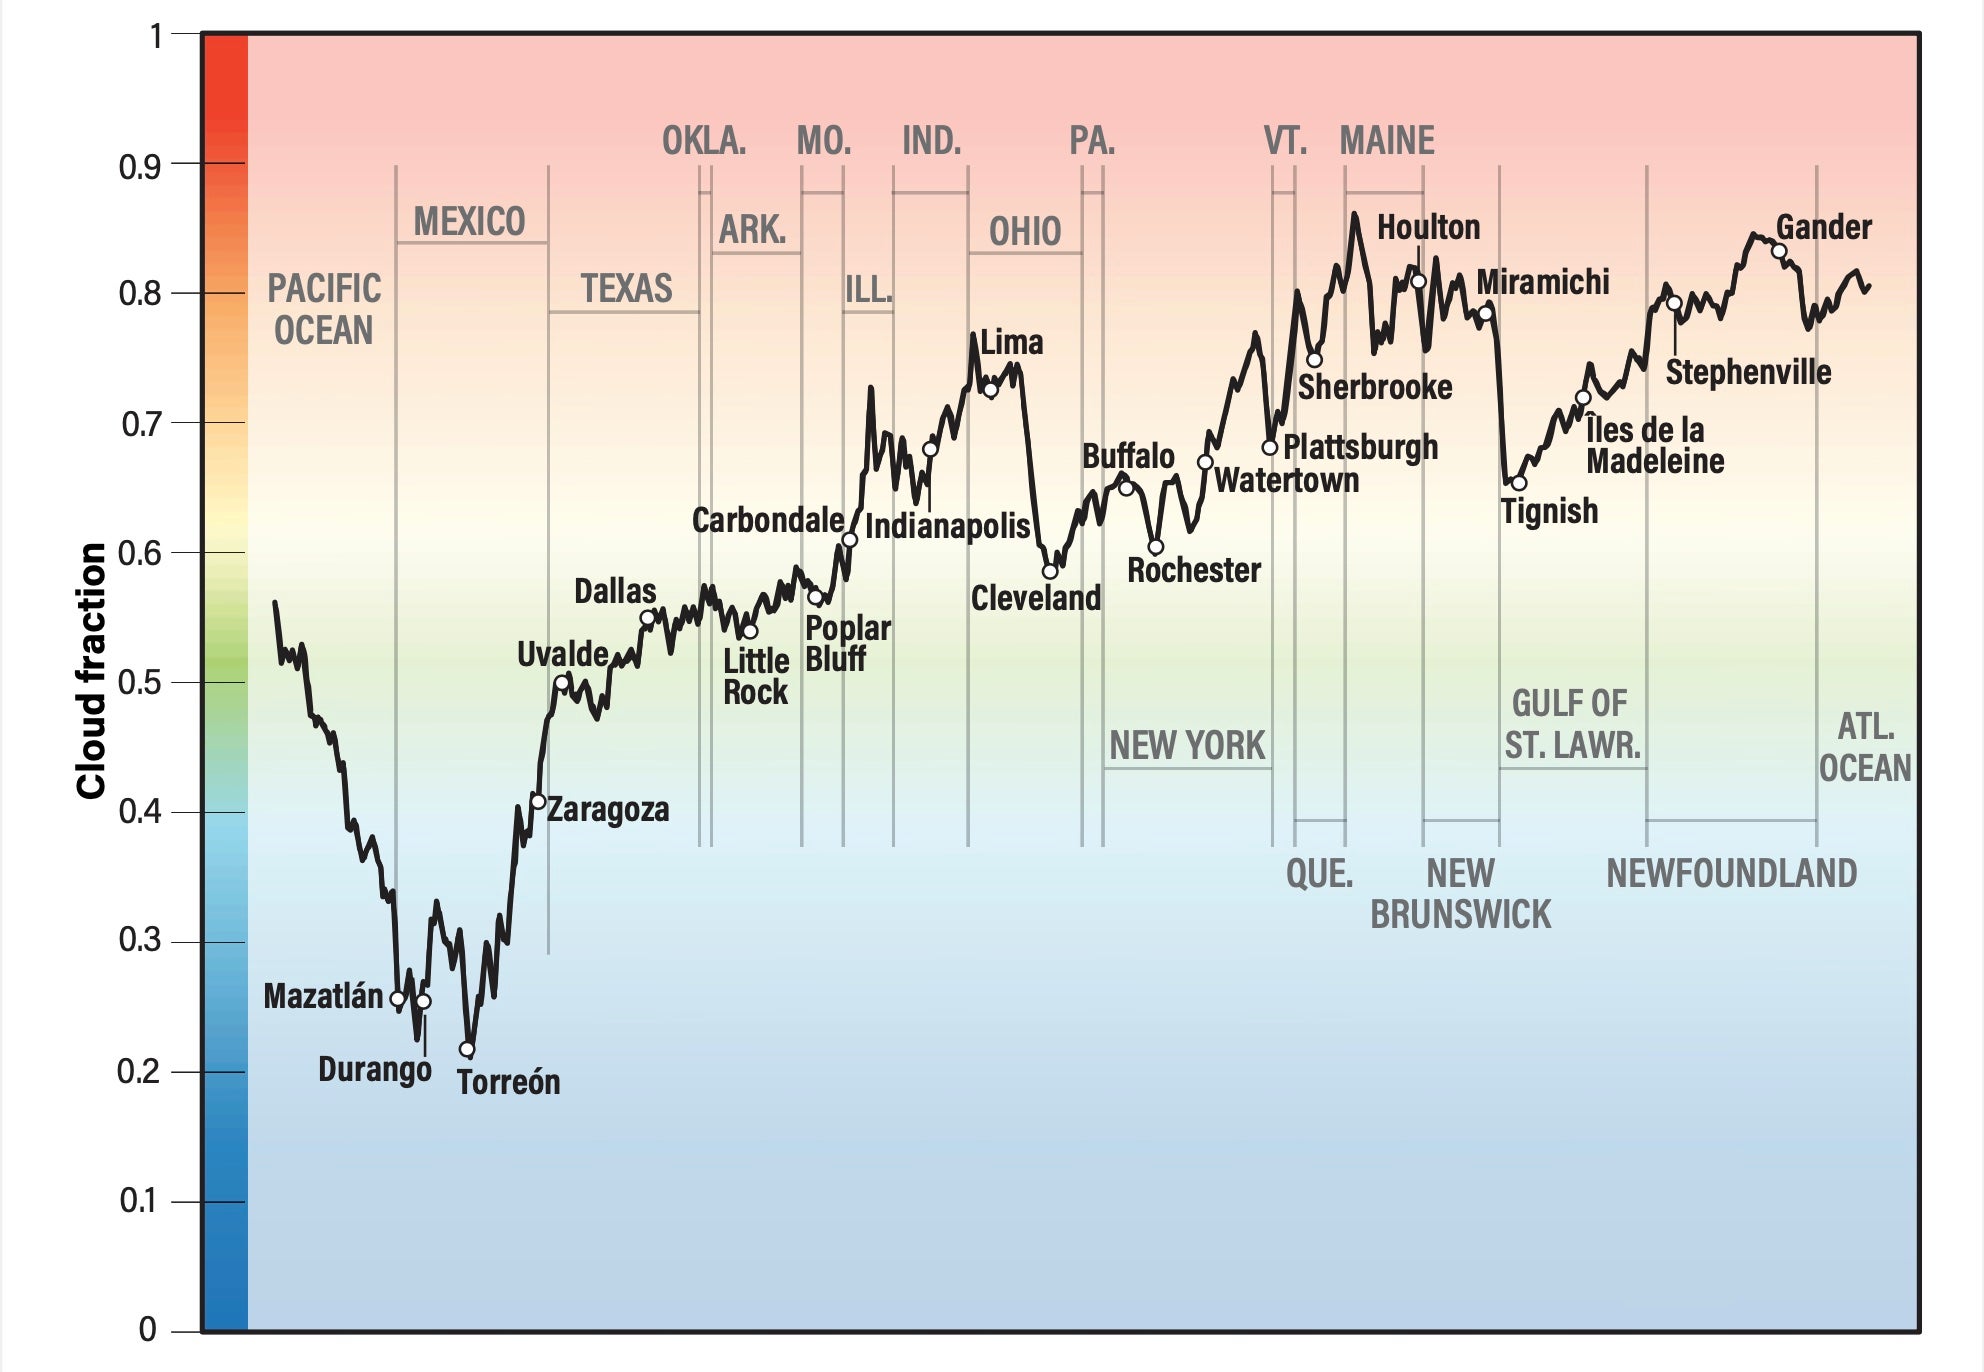
Data: NASA; Graph: Jay Anderson
April is the driest month for a large portion of the Mexican territory covered by the shadow’s path. The average monthly cloudiness drops to percentages in the low 20s at Mazatlán and inland, at Durango and Torreón. Beyond Torreón, April cloud cover climbs abruptly as the eclipse track comes under the increasing influence of two factors: moisture from the Gulf of Mexico and the 9,000-foot-high (2,800 meters) peaks of the Sierra Madre Oriental, which force this moisture to colder heights and cause clouds to condense.
The larger part of the cloudiness over Mexico is associated with the subtropical jet stream, which often lies along or atop the eclipse path. On quiet weather days, the jet may bring only thin cirrus clouds. But if a low-pressure system along the California coast is present, the subtropical jet is provoked into much thicker cloudiness while at the same time forming wave clouds and thunderstorms along and downstream of the western Sierra Madres; this will bring patches of overcast skies to the interior Mexican Plateau. Thunderstorms may also form over the mountains, but these will usually come too late in the day to bother the passage of the lunar shadow.
U.S. road trip
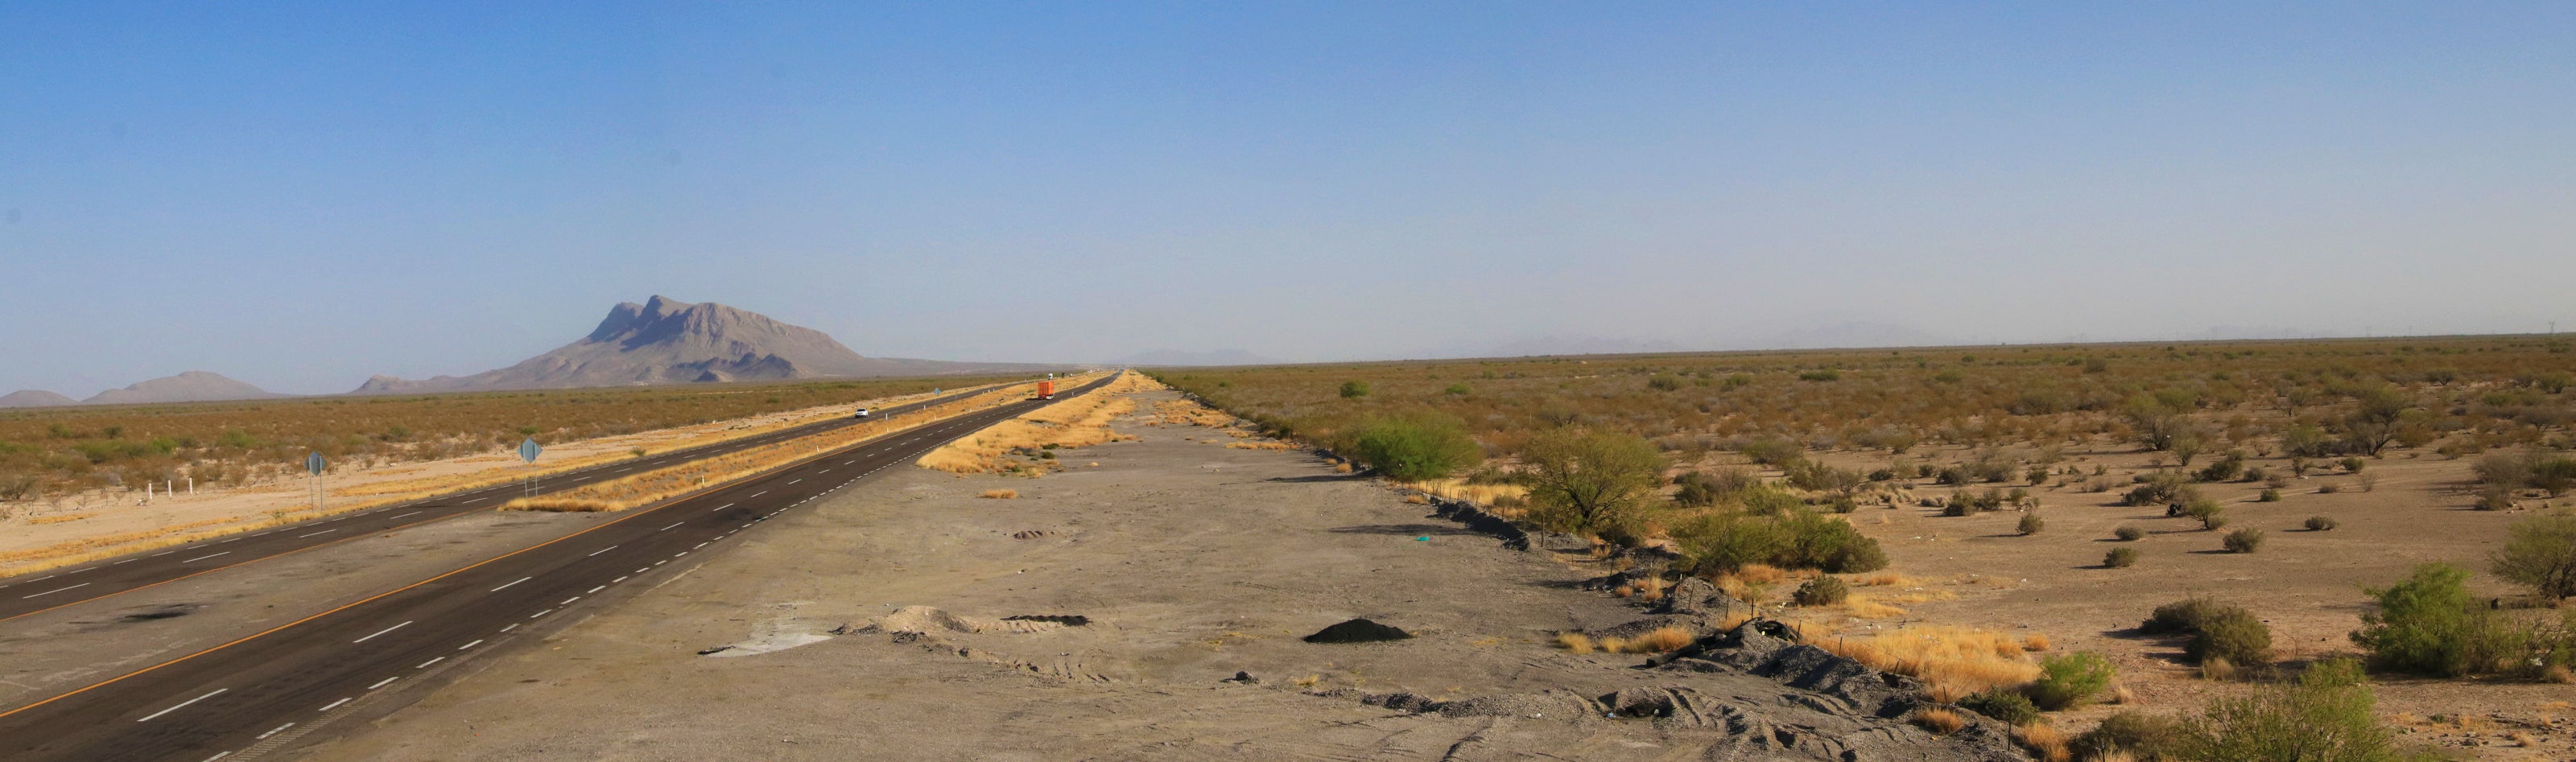
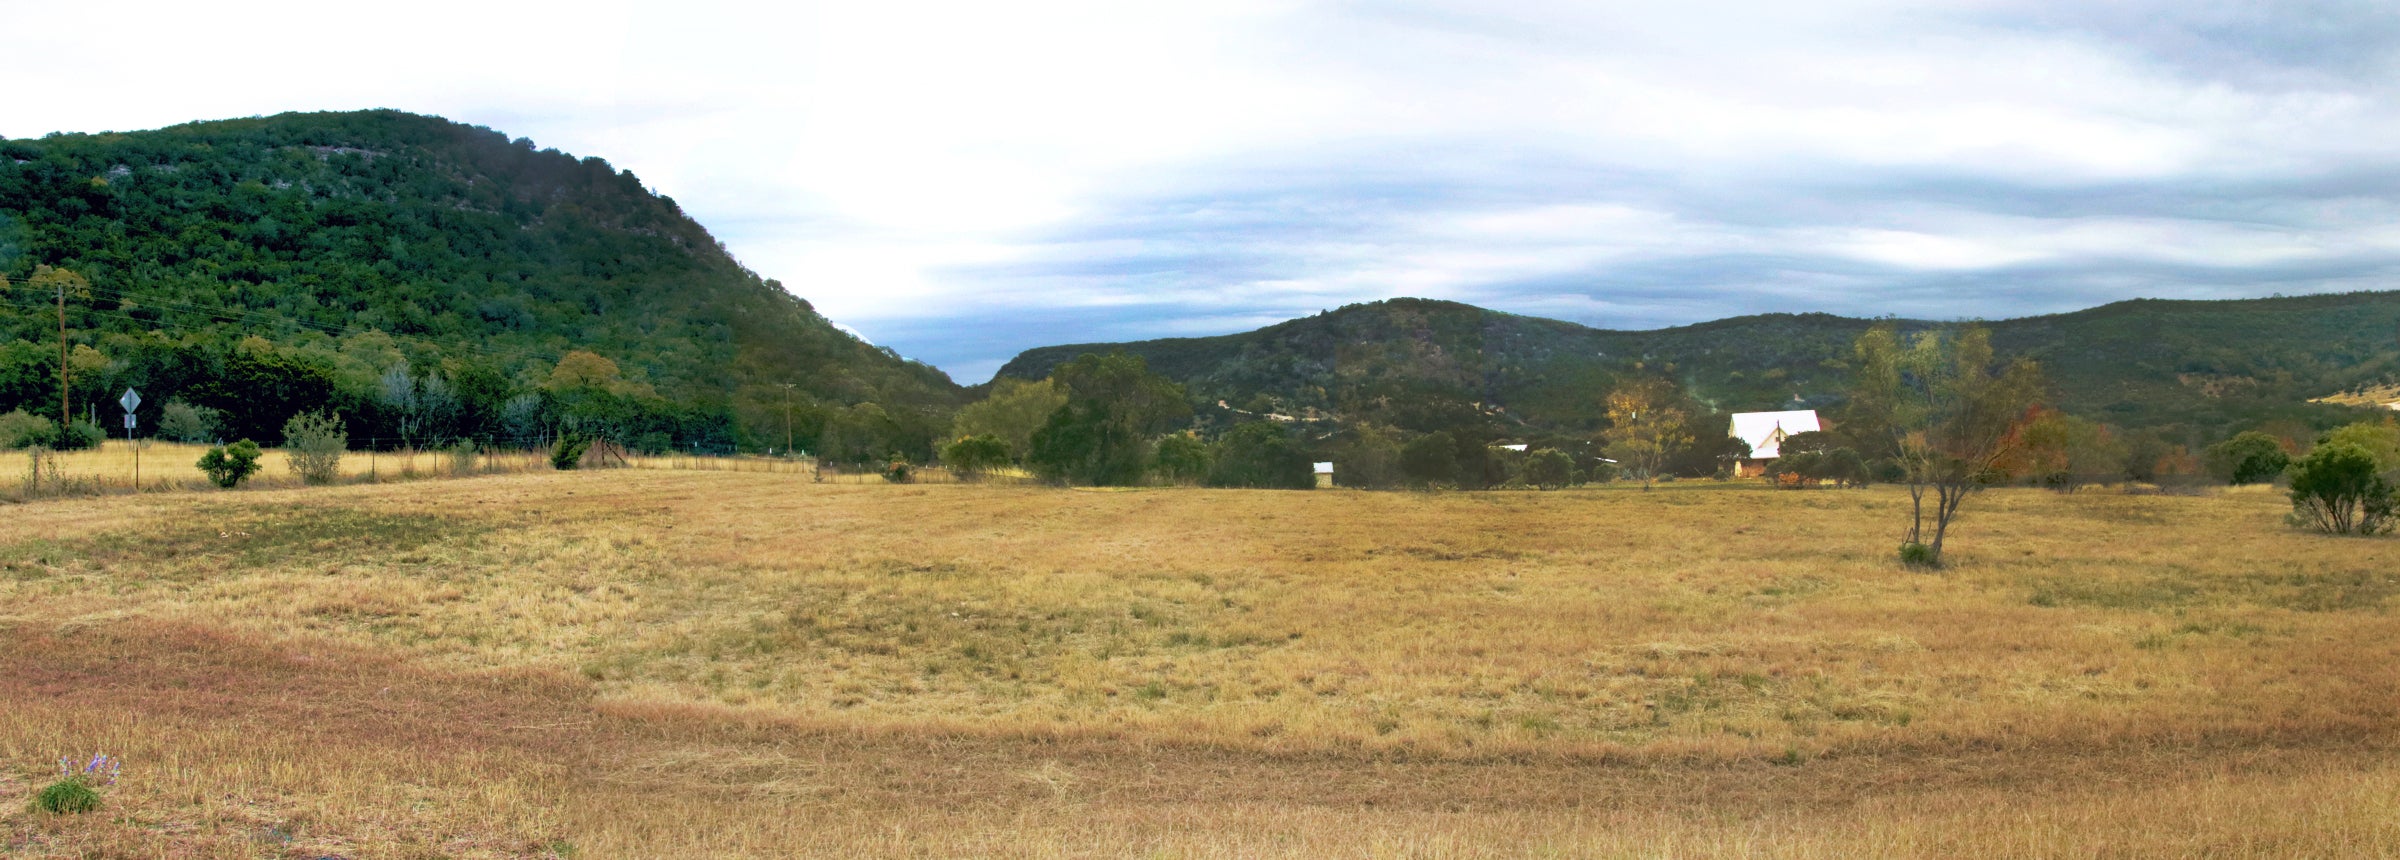
As the path enters Texas, elevations drop nearly to sea level along the Rio Grande Valley and the Gulf Coastal Plain. Moisture from the Gulf spreads easily across this lowland, past San Antonio, efore being impeded by terrain that rises onto the Edwards Plateau. This is Texas Hill Country, a rugged landscape of mixed forest and farmland. The map shows that cloud cover over the lowlands at the southern limit of the eclipse is nearly 20 percent higher than at the hilly northern limit, reaching a minimum near Junction, Texas. The region from Junction to the border town of Del Rio harbors the most promising eclipse-watching sites in the U.S., although it comes at the price of a significantly shorter eclipse because of its proximity to totality’s northern limit.
Past Waco, Texas, the Moon’s path encounters a slow but steady upward climb in cloud cover, rising to about 60 percent along the center line as it reaches Carbondale, Illinois, which also was in the path of 2017’s total eclipse. The track is much more likely to be clouded out on the south side over Arkansas’ Mississippi Alluvial Plain and the Missouri Bootheel; eclipse seekers in this region should plan on moving onto the Ozark Plateau near West Plains, Missouri.
Through Illinois and Indiana, April’s center-line cloud cover jumps upward by 10 to 15 percent, reaching a discouraging 75 percent as it moves into Ohio. The track is coming under the increasing influence of springtime low-pressure systems with their large cloud shields and just plain bad weather. At this latitude, we run into the first possibility of snow on eclipse day, though it’s only a fraction of the risk of encountering thunderstorms. Cloud cover is evenly spread and does not favor one side of the track over another — at least until the shadow path encounters Lake Erie.
One of the more intriguing aspects of the satellite cloud measurements is the presence of fewer clouds along the south shore of Lakes Erie and Ontario. This reduction — as much as 15 percent — is due to the influence of the lakes, which suppress the formation of convective clouds along their south shores when cold winds blow from the north. Clouds form when the ground is warmed, but the air must travel a short distance inland before the warming takes hold. The effect is quite limited, as the map shows, and so eclipse watchers should also watch the weather and head for the lakes’ shores if that cold flow is forecast. This pattern greatly favors Cleveland, and Buffalo and Rochester, New York, as eclipse-viewing sites but doesn’t help the northern side of the track over Canada, though there is a small effect at Leamington, Ontario, from Lake St. Clair. For the romantic, Niagara Falls also benefits from the lake effect, though only to a modest extent.
Up north
Data: NASA; Graph: Jay Anderson
Past Lake Ontario, the eclipse track encounters the rising terrain in the northern area of the Appalachian Mountains and cloud cover rises once again. Farther on, the shadow arrives at the highest monthly cloud levels anywhere along the track in Maine and New Brunswick, peaking at 85 percent around Maine’s Allagash Wilderness Waterway. Cloud amounts are about 10 percent lower over the southern side of the central line, favoring locations near Millinocket in Maine and Oromocto in New Brunswick.
The shadow path reaches the Gulf of St. Lawrence at Richibucto, New Brunswick, and runs into another sunny oasis where monthly average cloud cover plummets abruptly, falling from 80 to 65 percent at the shoreline. The influence of the Gulf’s cold water gives Tignish, on Prince Edward Island’s northern tip, the best eclipse weather prospects east of the Great Lakes. Perusal of 24 years of satellite imagery from April 8 reveals that for 10 of those, the eclipse would have been visible within this region — though occasionally through thin clouds.
Beyond the Gulf of St. Lawrence, the late-afternoon shadow reaches Newfoundland and is once again immersed in a heavily clouded landscape. The best prospects on the island are at the water’s edge, especially at Cape Bonavista, the last site on land from which the 2024 eclipse can be seen. Previous eclipse-day images show sunny skies in seven of the last 24 years at Bonavista from right along the shore.
El Niño’s impact
Cloud-cover statistics are only descriptive if the climate is stable. For the 2024 eclipse, forecasters will have to contend with a wild card: El Niño, the recurring climate pattern in which the Pacific trade winds weaken and cause warm water to build off the west coast of the Americas. As of this writing, El Niño is underway and expected to continue into the spring, raising the question of how representative past data are.
Satellite cloud data provide insight into the consequences of this phase of the El Niño Southern Oscillation (ENSO). By subtracting average cloud amounts in ENSO-neutral years from the amounts during El Niño years, a cloud-impact map can be derived. (See page 23.) This map is somewhat encouraging, as it shows a considerable decline in cloudiness along the track across inland Mexico and extending as far north as the Arkansas Bootheel and southern Illinois. The maximum impact lies in Texas, where average cloudiness declines up to 14 percent northwest of San Antonio. Over Mexico, cloudiness declines 5 to 10 percent. The southern part of the track in Illinois sees about a 5 percent reduction in cloudiness. For much of the rest of the track, El Niño has little impact.
Thanks to the addition of the ENSO data, the prospects for a view of the eclipse in the southern part of the track are given a boost. It’s important to remember, however, that on eclipse day, some areas that are expected to be cloudy will be clear, and vice versa. Turning your attention from climate trends to daily forecasts in the days ahead of April 8 will be essential.
Straight from the source
While media outlets throughout North America will be producing eclipse-day weather forecasts, serious eclipse seekers might want to look at the raw output from numerical computer models to form an independent opinion about the reliability of a forecast. There are many places to do this online. Storm chasers gravitate toward the College of DuPage, which publishes both satellite imagery and numerical model outputs at https://weather.cod.edu. During the April 2023 eclipse over Australia and East Timor, many eclipse chasers used Windy.com as their weather source, a resource that can be used worldwide. For site-specific forecasts, SpotWx.com will provide graphs of weather parameters going as far as 16 days into the future.
There are many meteorological models available from a multitude of countries, but the ones you are most likely to encounter are from the U.S., Canada, and Europe. Models — identified by acronyms — come in several flavors, mostly according to the length of the model period. The Canadian Global Deterministic Prediction System (GDPS), the U.S. Global Forecast System (GFS), and the European Center for Medium-Range Weather Forecasts (ECMWF) are long-range models, going out to around 15 days. Shorter-range models with higher resolution, such as the Regional Deterministic Prediction System (RDPS) and the North American Mesoscale (NAM), extend outward for about three and a half days.
There are others — the Rapid Refresh (RAP), High-Resolution Rapid Refresh (HRRR), and High Resolution Deterministic Prediction System (HRDPS) — but these are best left for short-range thunderstorm forecasting and don’t always give cloud-cover forecasts.
The best advice is to pick two or three of these models and compare their outputs. Don’t start relying on them until there is some consistency in the predictions both with each other and with their own previous forecasts, something that will begin about three days ahead of the eclipse. The long-range ECMWF enjoys the reputation of being the best of the models, but it’s not freely available like the Canadian and American models (though it can be accessed through Windy.com).
If you are a serious eclipse chaser, there is no reason to miss the 2024 total solar eclipse. Advance planning, attention to the climatology and forecasts, and a willingness to travel should deliver you to clear skies and a phenomenal show. If your time is more limited — it is a work day, after all — keep an eye on the forecasts and make an early start.
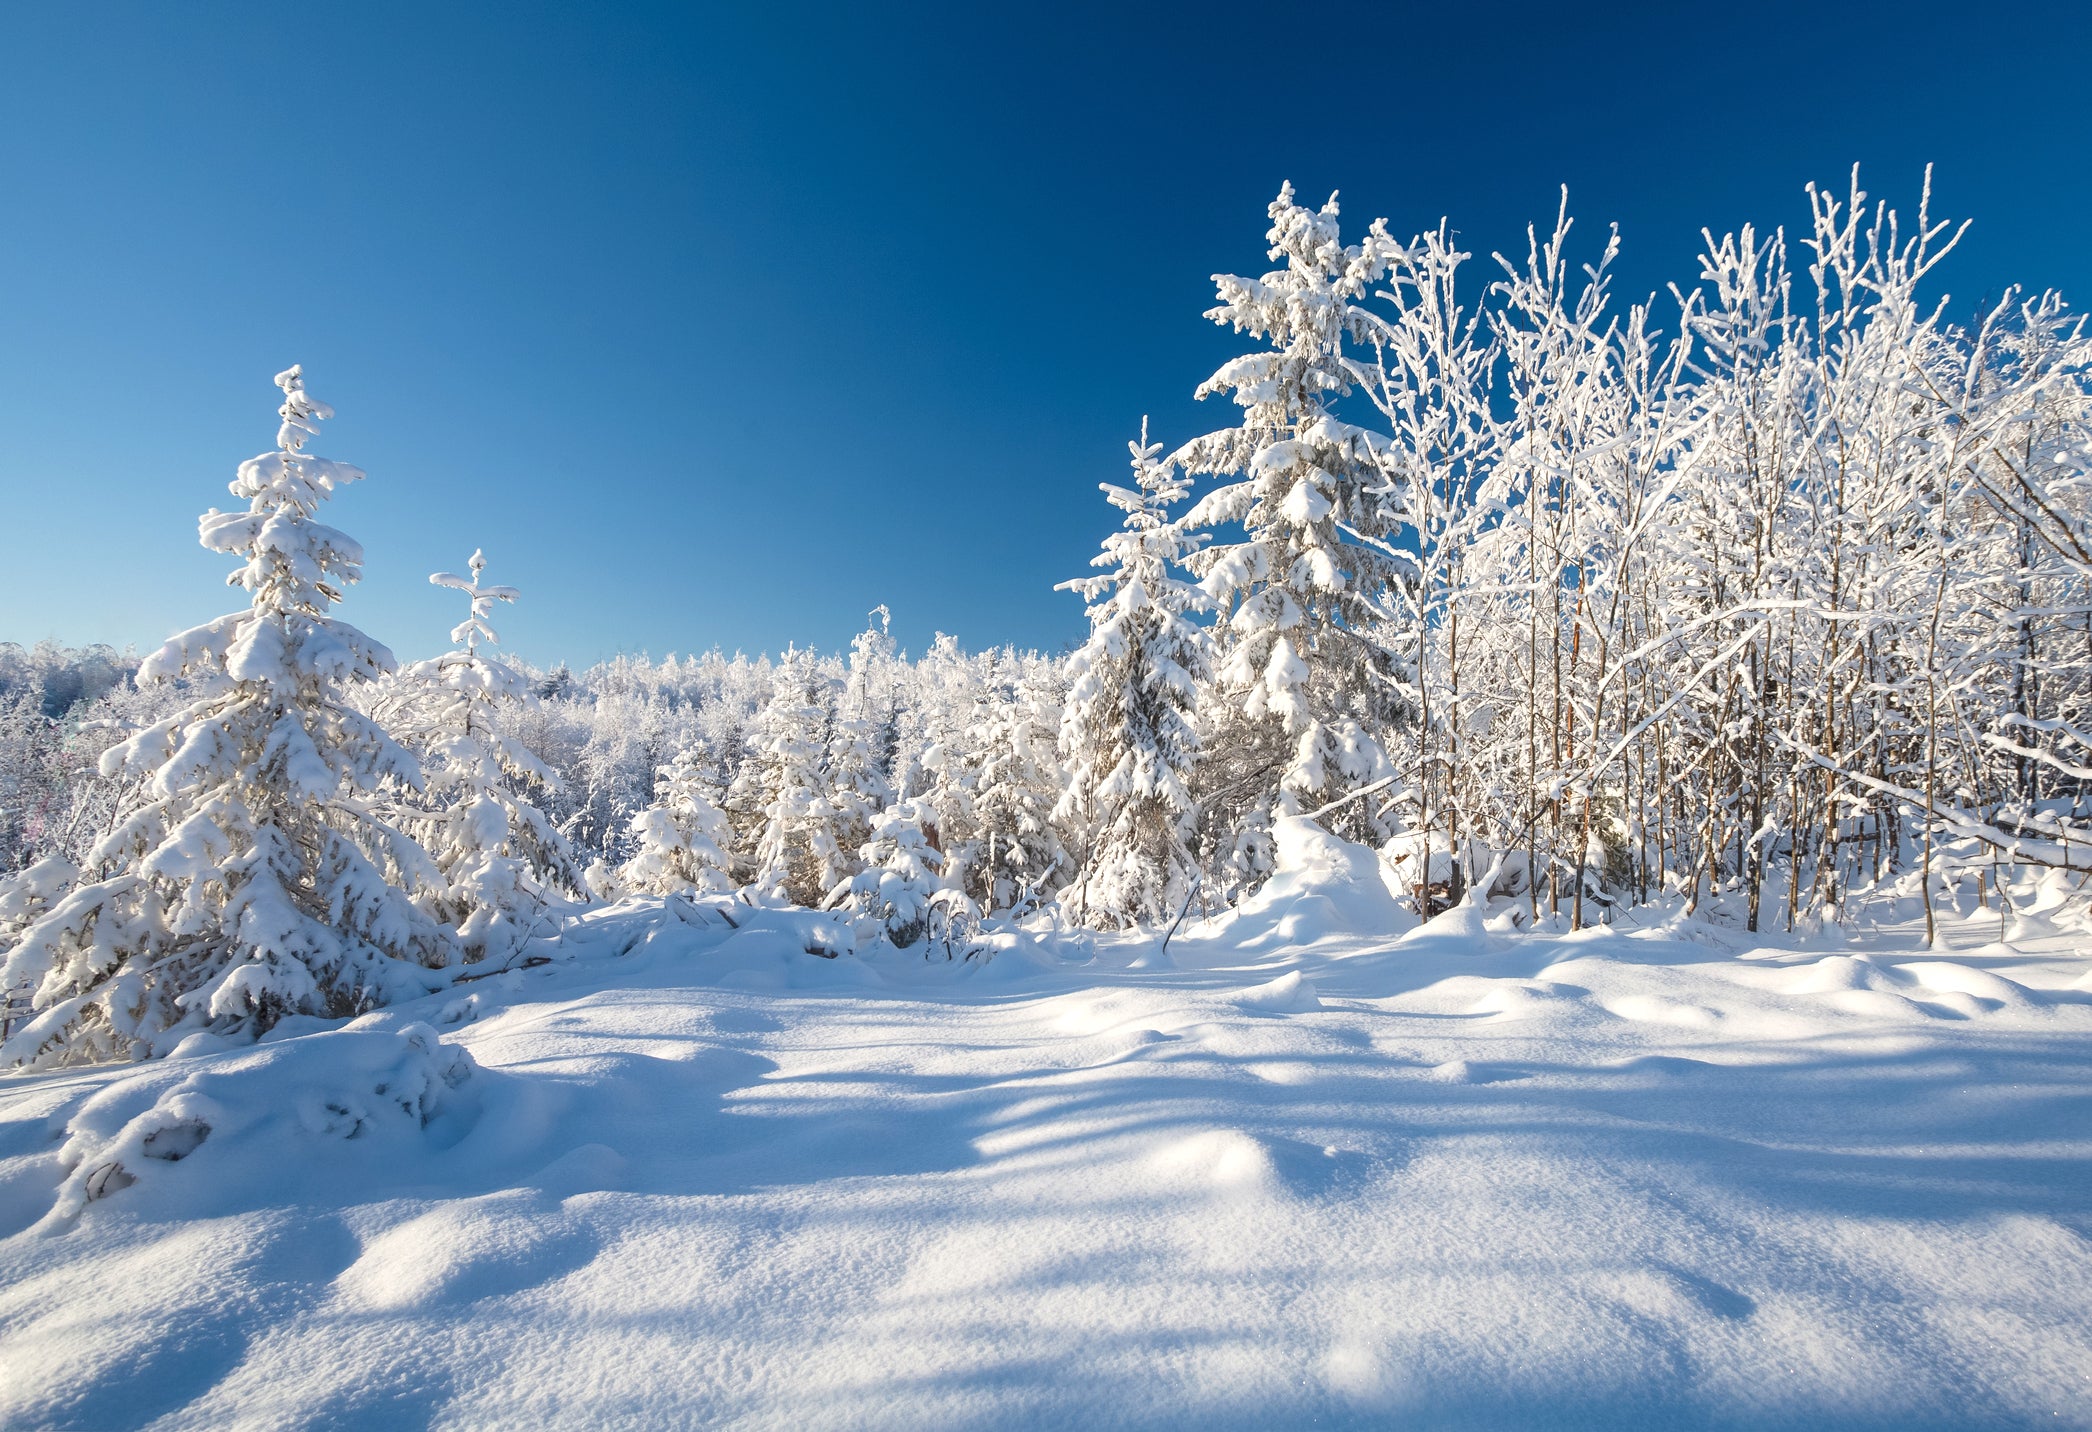
Don’t forget about the temperature!
As the track heads northward, wintery conditions become more and more likely. Average April snowfall amounts range between 2 and 4 inches (5 and 10 cm) in New York and Ontario, then climb to 7 to 12 in (18 to 30 cm) through Maine and New Brunswick and to as much as 16 in (41 cm) in Newfoundland. Average overnight lows throughout the northeastern part of the track usually fall below the freezing point in April.