When the Apollo 11 Lunar Module was running low on fuel and getting too close to the lunar surface to abort, alarms began to light up in Mission Control. The site for the July 20, 1969, landing had been carefully chosen, informed by years of careful observation and mapping of the Moon’s surface. Neil Armstrong was forced to take manual control to dodge boulders that could not have been detected by prior observations. But the familiarity with the terrain he had acquired from training — including simulations using maps of the landing site — paid off. When Armstrong radioed, “The Eagle has landed,” pandemonium broke out in Mission Control. Those years of planning and cartography had resulted in a fantastic achievement.
Not since the early age of global exploration had maps been so important to the success and survival of adventurers. This was a culmination of work begun nearly 400 years earlier, when Thomas Harriot, Galileo Galilei, and others first turned their telescopes on the Moon, revealing a world of wonder and surprise.
The first lunar maps
The rising of a bright Full Moon has inspired poets, songwriters, and torytellers. What they imagined they saw on its surface had a great deal to do with cultural context. The most obvious features visible without optical aid are the vast dark areas known as maria, or seas, which are bordered by lighter areas. Europeans would refer to these features as the man in the Moon, the Cowichan First Nation peoples in Canada’s Pacific Northwest see a toad, and the image of a rabbit is preferred in Asia — to name a few examples. However, these depictions of the Moon’s surface are not the same as maps.
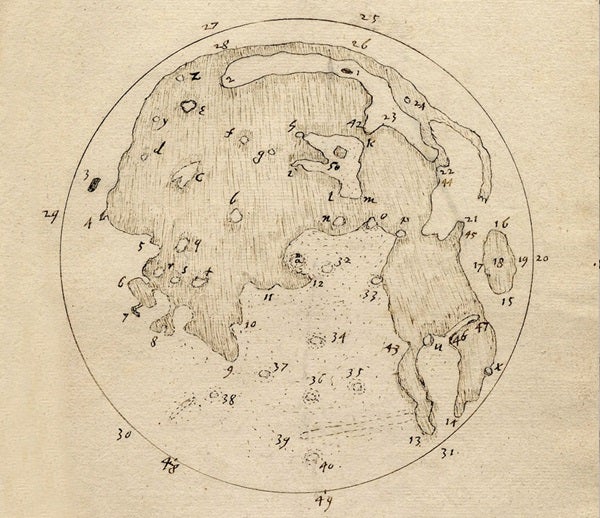
In 1608, news spread quickly through Europe of a new instrument that made distant objects appear closer. The telescope was first sold for military and mercantile purposes, but people soon turned it skyward. In England, Thomas Harriot was one of the first to seriously observe the Moon with such an instrument. He produced the earliest datable map of the Moon on July 26, 1609, though he never published it. Within a few years, Harriot had drawn maps with more details, including the dark seas and prominent craters displayed in correct proportion to each other.
Galileo burst onto the scene in March 1610 with the publication of his Sidereus Nuncius, or Starry Messenger. He realized that the interplay of light and shadow across the Moon indicated a rugged surface, which he captured in his drawings. This upended the wisdom of Aristotle from 2,000 years before, which held the Moon was in the realm of perfection and that there would be nothing to map!
It’s important here to understand the difference between cartography and topography. Harriot was interested in the spatial relationships of lunar features, in part to understand the wobble, or libration, of the Moon. This phenomenon means that over the course of one libration cycle, roughly 18 percent of the lunar farside can be seen creeping around the Moon’s limb. Thus, Harriot’s maps are two-dimensional and tried to capture the physical and spatial relationships of lunar features. Galileo’s sketches were topographic, creating a three-dimensional representation of the Moon that showed how its features varied in height.
Just 37 years after Galileo published his drawings of the Moon, Polish astronomer Johannes Hevelius released his book Selenographia (Pictures of the Moon). Unlike Galileo’s topographic artistry, Selenographia was a first attempt at organized lunar cartography. Hevelius made his money by brewing beer, but became fascinated with astronomy. He built an observatory and many of his own telescopes, including a tubeless instrument 150 feet (46 meters) long.
But why go to the trouble of mapping the Moon — a place no one would ever visit? The answer lies in trade and world power. As ships improved and trade increased, knowing your location at sea became of paramount importance. The problem of finding where you were on Earth was one of keeping accurate time. If you could determine your local time and compare it to the time at a reference location, such as London or Paris, you could find your longitude based on the time difference. But clocks in the 17th century were not reliable enough to keep an accurate reference time over months at sea.
Galileo had suggested using his newly discovered four moons of Jupiter and their regular, repeated motion as a kind of clock in the sky. Others thought the same could be done with lunar eclipses: By observing when the edge of Earth’s shadow crossed a given feature on the Moon, you could use an almanac to compare that time to when this happened back at your reference location, thus giving the difference in time and the longitude. Hevelius hoped his lunar maps might be a suitable reference for this method. Unfortunately, the observations were too difficult to make from the deck of a ship. And in any case, since lunar eclipses are not that frequent, the method would have been of limited use.
The solution to the longitude problem had to wait for a sea-going clock. Nonetheless, Hevelius’ maps continued to set the standard of lunar cartography for a century.
Picture perfect
In the second half of the 18th century, the president of the Royal Society, Joseph Banks, said features of the Moon could “only be rendered adequately by an artist.” One of the most prominent portrait artists of the day, John Russell, took up the challenge. Russell was obsessed with observing the Moon and was on close terms with astronomers William Herschel, Nevil Maskelyne, and others.
Russell was unimpressed by the lunar maps produced by the Italian-French astronomer Giovanni Domenico Cassini at the Paris Observatory, and thought he could do better. Russell spent every clear night observing the Moon with high-quality telescopes. As a portrait artist, he knew the importance of accuracy. He was careful to represent lunar features in their correct proportions and relationships, using triangulation and micrometers. As a result, the maps he produced are nearly photographic. His masterpiece was the Selenographia, a globe of the Moon that could demonstrate the effect of libration and the extent of the farside it reveals.
Actual lunar photographs would arrive courtesy of John William Draper, a chemist at what is now New York University. From a university rooftop in Greenwich Village, Draper captured the first detailed daguerreotype of the Full Moon in 1840. The moment was a milestone in how astronomers observe and map the Moon’s surface.
Early photographs also had detractors, including William Pickering, director of Harvard College Observatory. “[T]he best lunar photograph ever taken will not show what can be seen with a six-inch telescope under favorable atmospheric conditions,” he said, as reported by astronomer George Clark in a 1901 paper in The British Journal of Photography. When photographing the Moon, continued Clark, “what is really most interesting upon the moon — the finer detail and more delicate features … — the photograph does not hint at their existence.”
Part of the issue was that the long exposures that photographs of the era required meant that any atmospheric turbulence blurred the resulting image. “The eye can seize the instant of exquisite definition; the camera must take what comes,” Clark wrote.
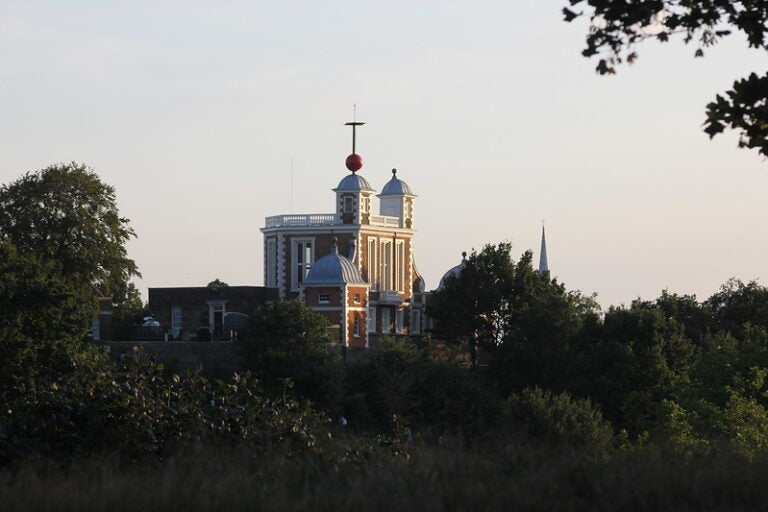
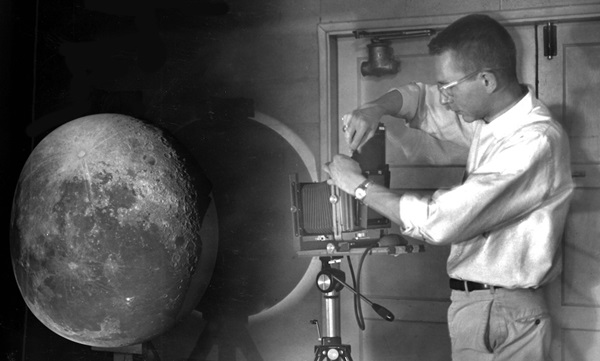
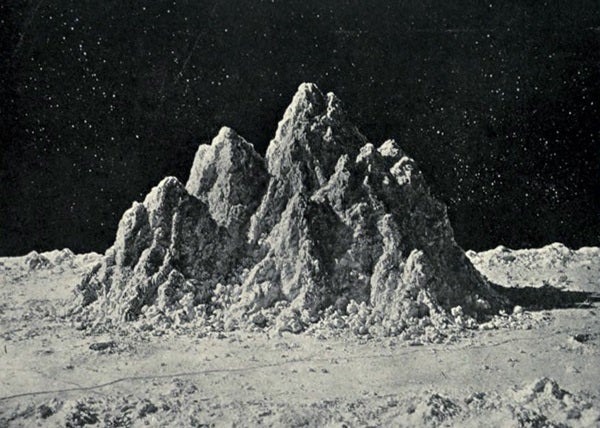
In an effort that illustrated the value of both visual acuity and photographic accuracy, in 1874, engineer James Nasmyth and astronomer James Carpenter of Greenwich Observatory published The Moon Considered as a Planet, a World, and a Satellite. The book drew on 30 years of Nasmyth’s personal observations and addressed topics ranging from the Moon’s rugged topography — which the authors claimed was due to volcanism — to the possibility of a lunar atmosphere.
But what astounded readers most were the incredibly detailed photographs of lunar features like craters and mountain ranges, which seemed to have been taken by spectators on the surface of the Moon! The photographs were ingenious special effects: To create them, the pair combined observations made by eye and using photography, plus some informed speculation, to create highly detailed plaster models. Then, they set the models against a black background and photographed them with strong, raking light to simulate the sunlit lunar surface.
The imagined craggy lunar landscape so impressed astronomers and readers alike that both men have craters named for them. Their vision of the Moon had tremendous staying power, influencing artists such as Lucien Rudaux, Chesley Bonestell, and even Walt Disney. But this imagery would change dramatically by the middle of the 20th century, when robotic probes began an intensive study of the lunar surface.
Visiting the Moon
In the early hours of a cool October morning in 1957, Americans learned that Earth had an additional satellite: Russia had successfully placed Sputnik I in orbit. This event launched the most expensive technology race in history, with the goal of putting humans on the Moon.
There were many parts to this complex puzzle, including the need for highly detailed maps of potential landing sites. To obtain them, Russia began by launching Luna 1 in 1959, with the intent to impact the lunar surface. It missed the Moon and was followed by Luna 2, which transmitted pictures until it slammed into the Moon’s surface. Luna 3 flew around the farside of the Moon and sent back pictures of terrain never before seen by human eyes. The blurry images showed a few large dark areas and heavily cratered landscape.
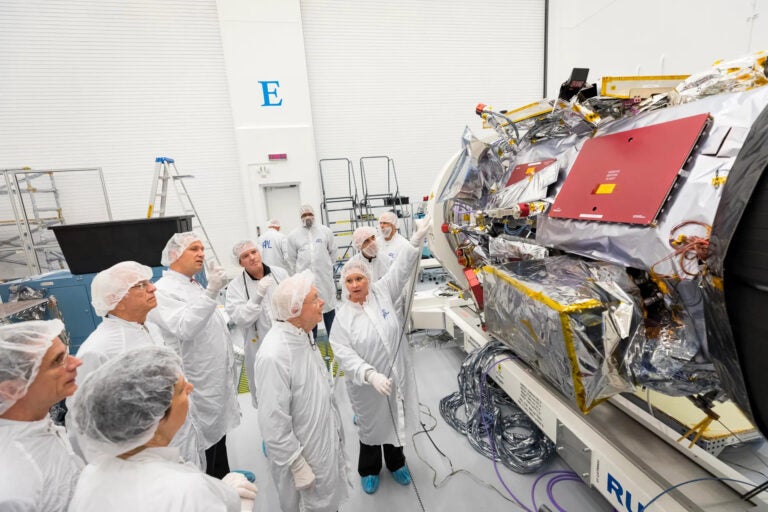
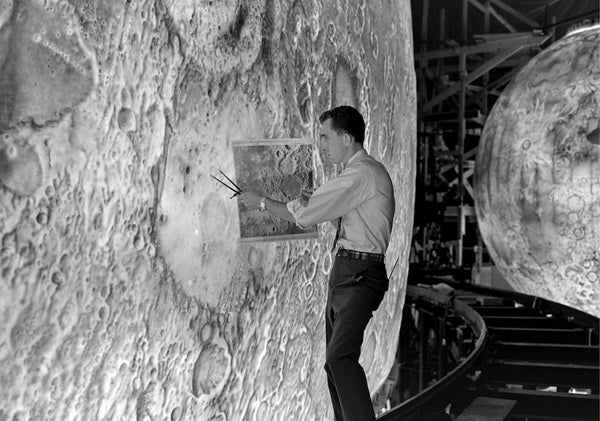
The U.S. responded with the Ranger program — a series of missions starting in 1961 to study the lunar surface — with mixed success. Five Lunar Orbiter missions followed between 1966 and 1967. These were incredibly successful. Their principal mission was to map areas of the Moon for potential Apollo landing sites, but after that was accomplished by the first three missions, the remaining two mapped essentially the entire surface.
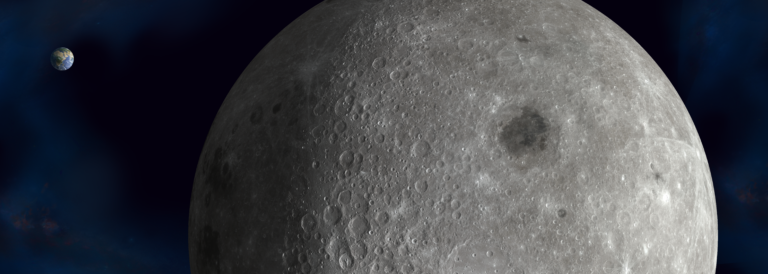
The mission’s high-resolution camera systems revealed the Moon’s farside to be very different than the side we always see — rugged, pockmarked with impact craters, and lacking the familiar dark seas of the nearside. The Apollo missions also added more information about the hidden side of the Moon. While two astronauts descended to the Moon, one remained in orbit, taking images and collecting data.
While crewed lunar missions ended nearly 50 years ago, the work of mapping the Moon continues. In 2009, the Lunar Reconnaissance Orbiter reached the Moon and is still imaging the surface and collecting data. Efforts have now gone beyond cartography and topography to include mapping out lunar resources such as minerals and even water, in anticipation of a long-term human presence on the Moon.
Charted territory
Our understanding of the Moon has come a long way. In the 19th century, curious visitors in Bonn, Germany, could visit an exhibition by Thomas Dickert: a 19-foot-wide (6 m) plaster model of the Moon. It was a matte yellow with exaggerated three-dimensional relief, based on lunar maps by astronomers Wilhelm Beer and Johann Madler and Russell’s drawings. If one walked around the back side, it would have been blank.
This remained the case with Moon globes well into the 1960s. Not so today. We have made incredible strides in understanding our neighbor. We have filled in its farside and gleaned cartographic information undreamed of just a few decades ago. From simple maps drawn while gazing though low-power telescopes to images from orbiting spacecraft peering deep into the Moon’s cratered surface, we now know our celestial partner in breathtaking detail.
The man who named the Moon
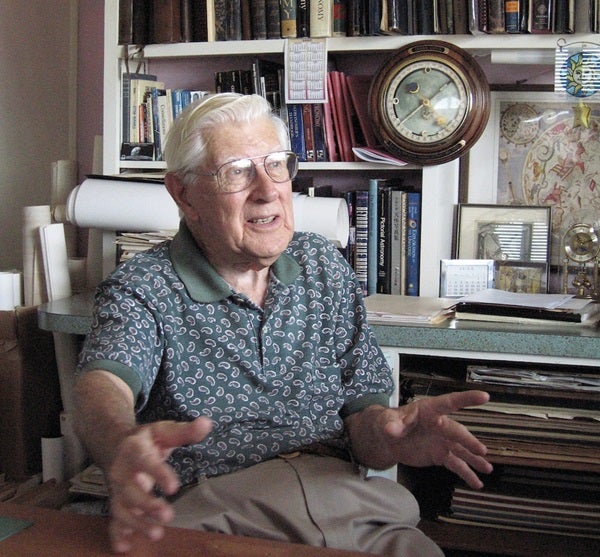
For centuries, astronomers around the world pinned names to lunar features as they saw fit, resulting in variations, duplication, and confusion. By the 1960s, lunar nomenclature needed to be standardized. The English-born Ewen Whitaker, then an amateur astronomer, took it upon himself to begin updating the official 1935 International Astronomical Union (IAU) Moon map for the Space Age.
Whitaker’s expertise was recognized by planetary scientist Gerard Kuiper, who recruited him to work at Yerkes Observatory in Wisconsin and, later, the University of Arizona. Whitaker’s own renown as the world’s foremost selenographer grew as he worked on the Orthographic Atlas of the Moon (1960–61) and the Rectified Lunar Atlas (1963), which were critical to NASA’s selection of landing sites for Moon missions, both robotic and Apollo. In the mid-1960s, the IAU adopted the set of crater names and lettered naming system that he and his collaborator David Arthur proposed.