Key Takeaways:
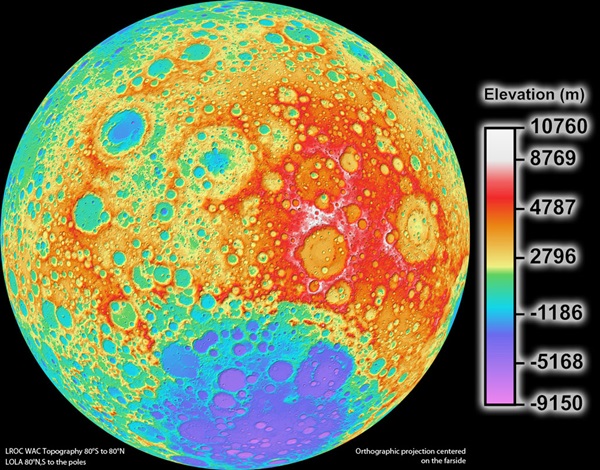
This new topographic map from Arizona State University in Tempe shows the surface shape and features over nearly the entire Moon with a pixel scale close to 328 feet (100 meters). A single measure of elevation (one pixel) is about the size of two football fields placed side by side.
Although the Moon is our closest neighbor, knowledge of its morphology is still limited. Due to instrumental limitations of previous missions, a global map of the Moon’s topography at high resolution has not existed until now. With the LRO Wide Angle Camera (WAC) and the Lunar Orbiter Laser Altimeter (LOLA) instrument, scientists can now accurately portray the shape of the entire Moon at high resolution.
“Our new topographic view of the Moon provides the dataset that lunar scientists have waited for since the Apollo era,” said Mark Robinson from Arizona State University. “We can now determine slopes of all major geologic terrains on the Moon at 100-meter [330 feet] scale, determine how the crust has deformed, better understand impact crater mechanics, investigate the nature of volcanic features, and better plan future robotic and human missions to the Moon.”
Called the Global Lunar DTM 100m topographic model (GLD100), this map was created based on data acquired by LRO’s WAC, which is part of the LROC imaging system. The LROC imaging system consists of two Narrow Angle Cameras (NACs) to provide high-resolution images, and the WAC to provide 100-meter-resolution images in seven color bands over a 35-mile (57 kilometers) swath.
The WAC is a relatively small instrument, easily fitting into the palm of one’s hand; however, despite its diminutive size, it maps nearly the entire Moon every month. Each month, the Moon’s lighting has changed so the WAC is continuously building up a record of how different rocks reflect light under different conditions and adding to the LROC library of stereo observations.
The LROC (WAC) has a pixel scale of about 245 feet (75m), and, at the average altitude of 30 miles (50km), a WAC image swath is 40 miles (70km) wide across the ground-track. Since the equatorial distance between orbits is about 20 miles (30km), there is complete overlap all the way around the Moon in one month. The orbit-to-orbit WAC overlap provides a strong stereo effect. Using digital photogrammetric techniques, a terrain model can be computed from the stereo overlap.
The near-global topographic map was constructed from 69,000 WAC stereo models and covers the latitude range 79°S to 79°N, 98.2 percent of the entire lunar surface. Due to persistent shadows near the poles, it is not possible to create a complete stereo-based map at the highest latitudes. However, another instrument onboard LRO called LOLA excels at mapping topography at the poles. Since LOLA ranges to the surface with its own lasers, and the LRO orbits converge at the poles, a high-resolution topographic model is possible, and can be used to fill in the WAC “hole at the pole.”
“Collecting the data and creating the new topographic map was a huge collaborative effort between the LRO project, the LOLA team, the LROC team at ASU, and in Germany at the DLR,” said Robinson. “I could not be more pleased with the quality of the map — it’s phenomenal! The richness of detail should inspire lunar geologists around the world for years to come.”
Shaded relief images can be created from the GLD100 by illuminating the “surface” (in this case the shape model) from a given Sun direction and elevation above the horizon. To convey an absolute sense of height, the resulting grayscale pixels are painted with colors that represent the altitude. Visualizations like these allow scientists to view the surface from different perspectives, providing a powerful tool for interpreting the geologic processes that have shaped the Moon.
Future Versions
The current model incorporates the first year of stereo imaging; there is another year of data that can be added to the solution. These additional stereo images will not only improve the sharpness (resolution) of the model, but also fill in small gaps that exist in the current map. Also, the LROC team has made small improvements to the camera distortion model, and the LOLA team has improved our knowledge of the spacecraft position over time. These next-generation steps will further improve the accuracy of the next version of the LROC GLD100 topographic model of the Moon.