Key Takeaways:
The team has compiled all the infrared images acquired by the Visual and Infrared Mapping Spectrometer (VIMS) during Cassini’s first 70 flybys of Titan. Fitting the pieces of the puzzle together is a painstaking task. The images must be corrected for differences in the illuminating conditions, and each image is filtered on a pixel-by-pixel basis to screen out atmospheric distortions.
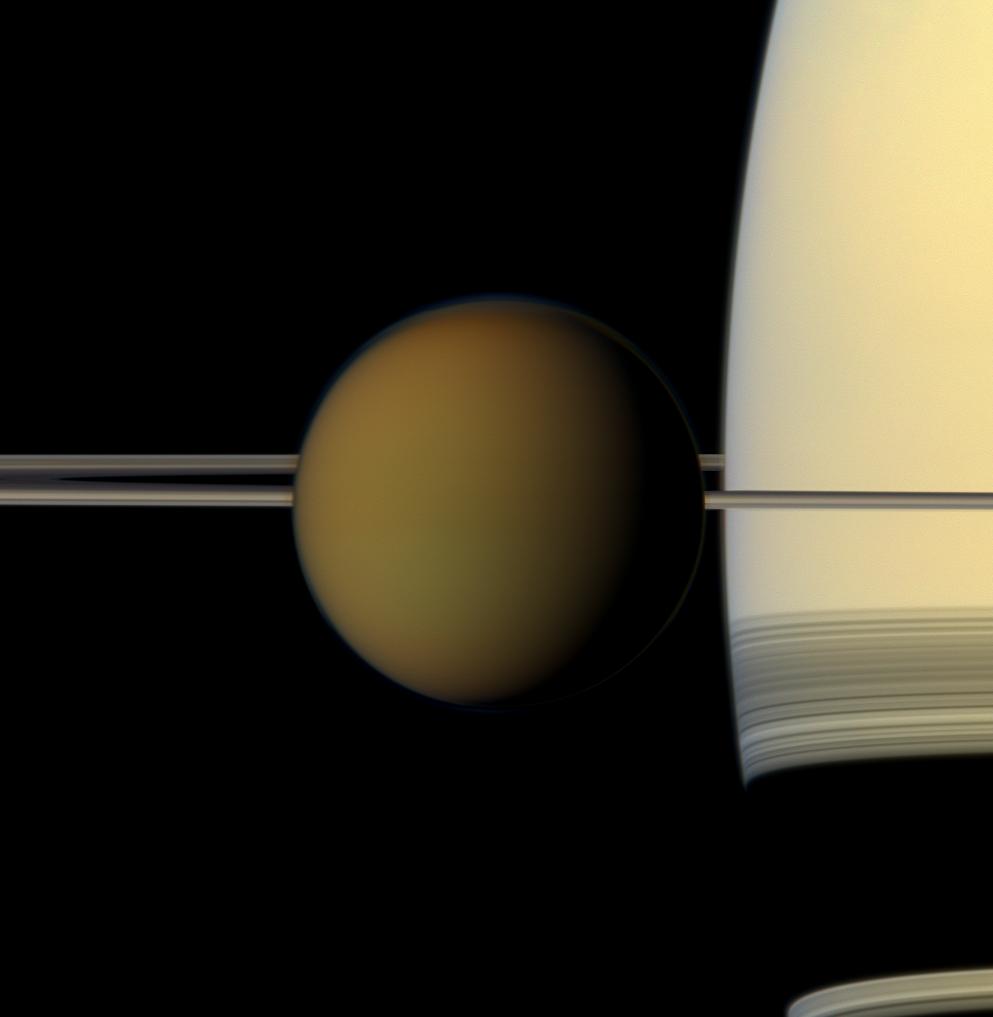
A thick, opaque atmosphere composed mainly of nitrogen veils Titan. It has clouds of methane and ethane, and there is increasing evidence for methane rain. Only a few specific infrared wavelengths can penetrate the cloud and haze to provide a window down to Titan’s surface. An exotic frozen world with many Earth-like geological features has progressively emerged from darkness.
“As Cassini is orbiting Saturn and not Titan, we can observe Titan only once a month on average,” said Stéphane Le Mouélic from the University of Nantes. “The surface of Titan is therefore revealed year after year, as pieces of the puzzle are progressively put together. Deriving a final map with no seams is challenging due to the effects of the atmosphere — clouds, mist, etc. — and due to the changing geometries of observation between each flyby.”
Cassini has made 78 flybys of Titan since it arrived in orbit around Saturn in July 2004. An additional 48 flybys are planned up to 2017. On flybys to date, VIMS has only had a few opportunities to observe Titan with a high spatial resolution. This means that the global map currently shows some regions of Titan in more detail than others.
“We have created the maps using low-resolution images as a background with the high-resolution data on top,” said Le Mouélic. “In the few opportunities where we have VIMS imagery from the closest approach, we can show details as low as 1,600 feet (500 meters) per pixel. An example of this is from the 47th flyby, which allowed the observation of the site where the Huygens descent module landed. This observation is a key one as it might help us to bridge the gap between the ground truth provided by Huygens, and ongoing global mapping from orbit, which will continue up to 2017.”
In addition to improving the spatial coverage, future mapping will allow the observation of seasonal changes in both the atmosphere and the surface. As spring comes to the northern hemispheres of Saturn and its moons, some areas are only now coming into view.
“Lakes in Titan’s northern hemisphere were first discovered by the RADAR instrument in 2006, appearing as completely smooth areas. However, we had to wait up to June 2010 to obtain the first infrared images of the northern lakes, emerging progressively from the northern winter darkness,” said Le Mouélic. “The infrared observations provide the additional opportunity to investigate the composition of the liquids within the lakes area. Liquid ethane has already been identified by this means.”
The team has compiled all the infrared images acquired by the Visual and Infrared Mapping Spectrometer (VIMS) during Cassini’s first 70 flybys of Titan. Fitting the pieces of the puzzle together is a painstaking task. The images must be corrected for differences in the illuminating conditions, and each image is filtered on a pixel-by-pixel basis to screen out atmospheric distortions.
A thick, opaque atmosphere composed mainly of nitrogen veils Titan. It has clouds of methane and ethane, and there is increasing evidence for methane rain. Only a few specific infrared wavelengths can penetrate the cloud and haze to provide a window down to Titan’s surface. An exotic frozen world with many Earth-like geological features has progressively emerged from darkness.
“As Cassini is orbiting Saturn and not Titan, we can observe Titan only once a month on average,” said Stéphane Le Mouélic from the University of Nantes. “The surface of Titan is therefore revealed year after year, as pieces of the puzzle are progressively put together. Deriving a final map with no seams is challenging due to the effects of the atmosphere — clouds, mist, etc. — and due to the changing geometries of observation between each flyby.”
Cassini has made 78 flybys of Titan since it arrived in orbit around Saturn in July 2004. An additional 48 flybys are planned up to 2017. On flybys to date, VIMS has only had a few opportunities to observe Titan with a high spatial resolution. This means that the global map currently shows some regions of Titan in more detail than others.
“We have created the maps using low-resolution images as a background with the high-resolution data on top,” said Le Mouélic. “In the few opportunities where we have VIMS imagery from the closest approach, we can show details as low as 1,600 feet (500 meters) per pixel. An example of this is from the 47th flyby, which allowed the observation of the site where the Huygens descent module landed. This observation is a key one as it might help us to bridge the gap between the ground truth provided by Huygens, and ongoing global mapping from orbit, which will continue up to 2017.”
In addition to improving the spatial coverage, future mapping will allow the observation of seasonal changes in both the atmosphere and the surface. As spring comes to the northern hemispheres of Saturn and its moons, some areas are only now coming into view.
“Lakes in Titan’s northern hemisphere were first discovered by the RADAR instrument in 2006, appearing as completely smooth areas. However, we had to wait up to June 2010 to obtain the first infrared images of the northern lakes, emerging progressively from the northern winter darkness,” said Le Mouélic. “The infrared observations provide the additional opportunity to investigate the composition of the liquids within the lakes area. Liquid ethane has already been identified by this means.”