Even with these constraints, you could do a pretty good job of figuring out how the forest worked or reconstructing the life cycle of a pine tree. You would see seedlings popping up out of the forest floor, mature trees, and dead logs. By seeing trees in all stages of growth and death, you could ascertain their life cycles. You would also realize that there are many different kinds of trees — oak, pine, and spruce — and understand how their life cycles differed from one another. It wouldn’t be easy. You might find yourself engaged in debates with other scientists about whether oaks and pines were separate species or different stages in the life of a single tree. But in the end, you probably would succeed in your task.
While no one would ever try to study a forest this way, astronomers are forced to study stars under a similar set of rules. The reason is simple: human lifetimes are measured in decades, science in centuries, but most stars live for billions of years. Compared to the lifetimes of stars, the entire record of systematic observations of the heavens is little more than the blink of an eye. Like the would-be forester, astronomers are armed only with snapshots of a single moment in the life of the universe.
But even with these restrictions, astronomers have pieced together the life cycles of stars. One of the crucial steps on this road to understanding was the development of the Hertzsprung-Russell diagram.
Astronomers at the end of the 1800s knew that stars had a finite lifetime, but they had no idea where stars’ energy came from. They could identify some of the chemical elements in stars by looking at their spectra. They could even measure the distances to nearby stars.
But they were confronted with a problem — there are many types of stars in the sky. Some stars are white-hot, others burn a cool red. Some are much bigger than the sun, others are much smaller. Like all scientists confronting complex natural phenomena, their first job was to try to bring some order to the part of the universe they were observing.
When scientists are confronted with a collection of objects, they try to find similarities that allow them to define groups and differentiate one group from others. In the 1700s, Swedish biologist Carolus Linnaeus noted that squirrels were more like rabbits than they were like snakes, and that snakes, rabbits, and squirrels were more like one another than they were like palm trees. This led him to our present scheme for classifying living things based on genus and species.
The first person to classify stars was Italian astronomer and Jesuit priest Angelo Secchi. In the 1860s, he set out “to see if the composition of the stars is as varied as the stars are innumerable.” Working with spectra of 4,000 stars, he found that they could be categorized into four separate classes. These ranged from bright, white stars with lots of hydrogen to faint, reddish stars with lots of carbon.
Secchi felt (correctly, as it turned out) that these differences arose because his different classes of stars had different temperatures. That isn’t too surprising. A piece of metal placed in a flame first glows dull red, then becomes white-hot as its temperature rises. But astronomers knew the differences in stellar spectra could also have arisen because of different chemical compositions. This quandary provided one of the main battlegrounds for the remainder of the 19th century.
On one side stood astronomers who believed that all stars have more or less the same initial chemical composition, but that their spectra change as they go through their life cycles. On the other side were those who argued that different groups of stars were made from different collections of chemicals. Astronomers had little understanding of how atoms emit light and how conditions in a star might affect that emission, so resolving this issue was not a simple matter. In the words of American astronomer Walter Sydney Adams, “We can hardly hope to understand the behavior of matter in distant stars when the mechanism of light given out by a candle flame is still quite unknown to us.”
The debate was hampered by other kinds of ignorance as well. For example, astronomers who argued that differences in stars were due to evolutionary processes didn’t know just how that evolution might take place. One popular theory held that stars derive energy from heat released as gases contracted under the force of gravity. A star would contract until the center liquefied and could contract no more, at which point the star would start to cool off and die. Each star would pass through a given temperature twice — once in the warming phase, and again during cooling. A given spectrum would appear twice in a star’s lifetime, corresponding to the two times it reached a particular temperature.
Determining distance, while possible for nearby stars, took a long time and hadn’t been done for many. Similarly, taking stellar spectra required that light from an individual star be isolated, run through a prism, and allowed to strike a photographic plate. A single exposure could take anywhere from minutes to hours, depending on the star’s brightness. Again, the process was too laborious to be used in large-scale surveys.
But all this changed in 1886. Harvard College Observatory, under the direction of Edward Pickering, initiated a survey of the spectra of bright stars in the Northern Hemisphere. Called the Draper Catalogue (after Henry Draper, a pioneer of American astronomy), it was assembled using a new technique. Instead of isolating the light from each of the stars in a field to obtain one spectrum per photographic exposure, a prism dispersed the total light from the field. Consequently, photos contained multiple bands, with each band representing the spectrum of one star. Spectra of many stars could finally be taken simultaneously. For the first time, stellar classifiers could work with a large database. “The Americans,” retorted one English astronomer, “have always been appreciative of mass production techniques.”
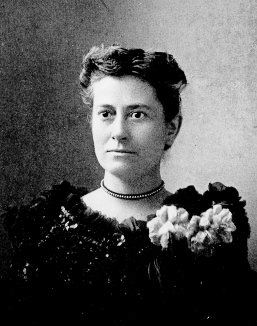
Stellar classification has the distinction of being the first major advance in astronomy in which women played a leading role. The first stellar classification work reminiscent of the modern classification scheme was devised by Pickering and his assistant Williamina Fleming. They classified stars alphabetically A through Q based upon the strength of hydrogen lines in the spectrum.
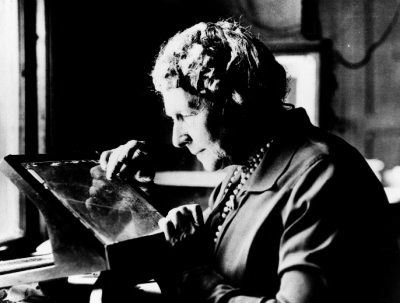
After Maury left Harvard due to differences with Pickering, Pickering turned to Annie Jump Cannon. Cannon analyzed the spectra of 1,100 individual stars. Rather than focus solely on hydrogen lines, she rearranged the sequence to represent a smoother progression of spectral features due to the presence of highly ionized elements such as helium, nitrogen, and silicon. Like Maury’s before, Cannon’s classification system began with O, with the final sequence reading O, B, A, F, G, K, and M. In addition, Cannon’s scheme resulted in the ordering of stars according to color, ranging from blue O stars to red M stars.
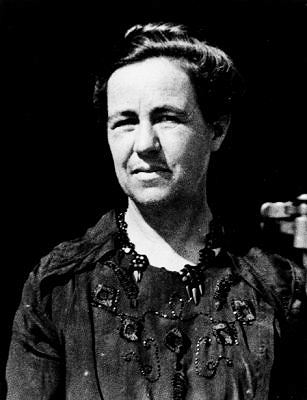
Today, we understand that Cannon’s classes correspond to different stellar temperatures. The hottest stars, with temperatures around 40,000 kelvins (70,000° F), are called O stars. The sun, with a surface temperature of 5800 kelvins (10,400° F), is a G star. While Maury’s system was far too complex to be useful, her discovery of important distinctions not captured by the original classification system was a crucial step forward, because it inspired the work of Danish astronomer Ejnar Hertzsprung.
Hertzsprung was born into a prosperous family in Denmark. He studied chemical engineering and came to astronomy by working on the chemistry of photographic film. Looking closely at red stars using Maury’s classification scheme, he found that stars in Maury’s subdivisions moved at different rates and were therefore at different distances. The fainter stars moved rapidly, which meant that they were close to Earth. These stars appear faint because they are faint. Another group of red stars — Maury’s c stars — barely moved at all, which meant that they had to be far away. These stars actually emit lots of light but appear faint because of their distance.
Hertzsprung realized that if a star has a low surface temperature, as was true for red stars, each square foot of surface area emits a relatively small amount of light. The only way such a star can emit a lot of light is if it has a large surface area. Today, we call these stars red giants and supergiants and recognize them as a late stage in the life of stars. When the sun becomes a red giant 6 billion years from now, its outer atmosphere will extend outside the present orbit of Earth. Hertzsprung’s work established that there were two parallel series of stars — dwarfs and giants.
Hertzsprung’s discovery meant that determining a star’s temperature doesn’t tell astronomers everything they need to know about it. A classification scheme based on temperature alone will mix together very different objects — faint red stars and red giants, apples and oranges. When he plotted stellar luminosities against Maury’s spectral classes, he found that the stars fell into two main groups. Most of the stars, the dwarfs, fell in a band he called the main sequence. The others were the giants.
At the same time, American astronomer Henry Norris Russell began looking at the same kinds of problems at Princeton University. But whereas Hertzsprung had been motivated primarily by trying to straighten out the classification of stellar spectra, Russell was trying to determine how stars evolve. He helped set up one of the first stellar distance measurement programs by using photographic plates instead of visual observations. So when he tackled the problem of red stars, he had direct data on their distances.
In 1909, Russell came to the same conclusion reached by Hertzsprung: There were two kinds of stars, dwarfs and giants. Like Hertzsprung, he also noted that for most stars, the hotter the surface, the more energy the star poured into space. Russell didn’t announce his results until June 1913 at a meeting in London, and again in December at a meeting of the Astronomical and Astrophysical Society in Atlanta.
Because Russell was the first to publish the diagram in something close to its modern form, and because he presented his work in mainstream publications and meetings, he received the lion’s share of credit when the usefulness of the diagram became apparent to other astronomers. For years it was known as the “Russell diagram.” In 1933, Swedish astronomer Bengt Strömgren resurrected Hertzsprung’s old papers and argued for his having made the discovery independently of Russell. It’s been the HR diagram ever since.
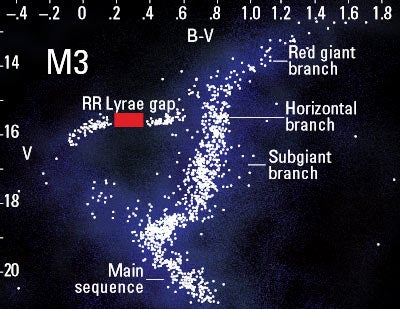
All the complexity of the different kinds of stars is contained in this diagram. A star’s temperature lies on the horizontal axis and its luminosity lies on the vertical. The HR diagram reveals three important groupings of stars. The most striking is the broad band running from the upper left (hot and bright) to lower right (cool and dim). This band, which includes the sun, is Hertzsprung’s main sequence and includes stars that generate their energy by fusing hydrogen into helium. The stars in the upper right hand corner (cool and bright) are the red giants.
The stars in the lower left (hot and dim) are called white dwarfs. These stars are no longer running nuclear reactions and shine only because they are cooling off. Think of them as stellar cinders. Although a few white dwarfs can be seen in both Hertzsprung’s and Russell’s original plots, neither one felt he had enough information to comment on this class of stars, and it was a decade later before astronomers came to recognize their true nature.
But the main point was clear. When entered on the HR diagram, virtually all stars fall into one of these three classes, and within the main sequence, the hotter stars are more luminous than cooler ones. Hertzsprung and Russell independently discovered this fact about the main sequence — the former by plotting stars in large clusters, the latter from his distance measurement data.
Not only can every star be represented by a point on the HR diagram, but the life cycle of every star can be represented by a trajectory. For example, the sun begins on the right as a cool, contracting cloud of interstellar gas. As it warms up, it moves left toward the main sequence. Finally, when the nuclear fires ignite and the star begins to fuse hydrogen, it sits on the main sequence, staying more or less in one place until all the hydrogen in the core is consumed. The sun will spend about 11 billion years on the main sequence, of which 4.6 billion years have already passed. When the hydrogen in the core is exhausted, more complex nuclear reactions begin. These reactions will cause the sun’s surface to cool and swell up, at which point the sun moves to the red giant part of the diagram. Finally, when all nuclear reactions stop, the sun becomes a hot cinder in space and moves down to the white dwarf region.
Thus, the HR diagram solved the problem of classifying stars. It orders the stars by placing them as specific points on the diagram, and it tells astronomers about stellar life cycles because each star’s history and future can be represented by a single curve. No wonder that the HR diagram has become the workhorse of modern stellar astronomy!