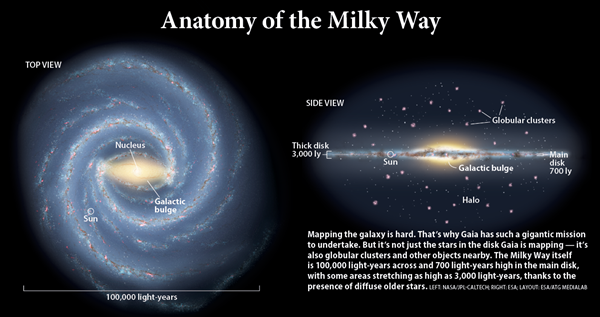
Over millennia, huge advances have been made in astronomy, but some surprisingly basic questions remain: Where exactly are the stars? Where, in the grand scheme of things, is Earth? What is the shape and structure of our home galaxy?
We’ve come a long way from thinking of the stars as a two-dimensional projection on the sky, but measuring a star’s distance remains quite tricky. And even tracking a star’s motion across the sky in two dimensions is difficult without years of data.
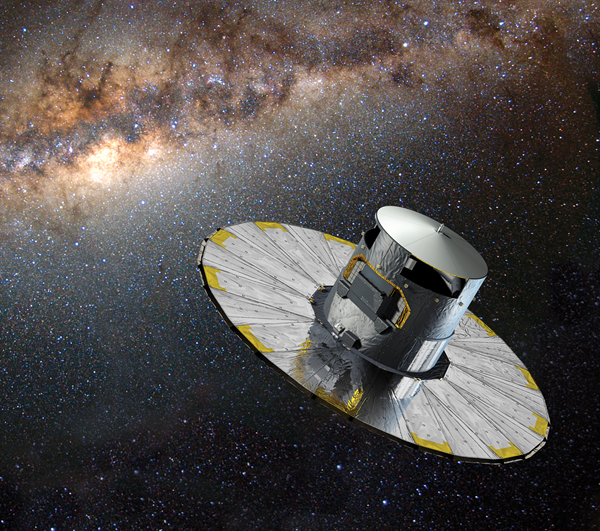
In 1989, the European Space Agency (ESA) launched the Hipparcos satellite to measure the positions of 2.5 million stars, a catalog that wasn’t released in full until 2000. In 2013, ESA launched Gaia, which will return even higher-precision data on over a billion stars. Gaia was a Greek goddess who was regarded as a sort of Mother Earth. The ESA mission originally stood for “Global Astrometric Interferometer for Astrophysics.” Though many of the parameters changed, ESA kept the name for mission continuity.
Gaia won’t complete its mission until 2019, and the final data analysis won’t be available until years afterward. But in September 2015, the Gaia science team released a first round of data from 14 months of observing, and welcomed scientists around the globe to jump in. The results are already changing astronomers’ perspective of our galaxy.
By the numbers
Gaia’s mission statement is to “map a billion stars,” but even this bold promise undersells the space observatory’s true abilities. Gaia, orbiting around 932,000 miles (1.5 million kilometers) away and mapping the whole sky, carries three instruments. Its astrometric instrument charts positions and motions of stars with pinpoint precision by observing how they appear to move over the course of Gaia’s five-year mission. Its photometric camera measures the brightness of stars at both red and blue wavelengths, producing data about their temperatures and compositions. Finally, the spectrometer measures the Doppler shift of particular chemical signatures to reveal whether stars are moving toward or away from Earth. (For an in-depth overview of Gaia’s design and mission, check out Astronomy’s December 2014 story, “How Gaia will map a billion stars.”)
Eventually, Gaia’s goal is to plot the distance of 100 million stars to better than 10 percent accuracy. For 10 million objects, its margin of error will be less than 1 percent. It will measure the positions and motions of more than 1 billion stars across the whole sky, down to 20th magnitude, with an accuracy of a few millionths of an arcsecond, crushing previous surveys.
For this first data release, though, Gaia needed some help. Gaia measures the motions of stars to determine their distance. From only the first year of data, it’s impossible to untangle the motion of the stars from the telescope’s own motion as it follows Earth’s orbit around the Sun. But the Hipparcos satellite has already done this work once, for millions of Gaia’s target stars. The Hipparcos catalog knows where these stars were 20 years ago, and Gaia knows where they are now, to even better precision. That extended timeline was just what Gaia needed.
So the Gaia team combined the final Hipparcos catalog, called Hipparcos-Tycho 2, with Gaia’s data thus far. The Tycho-Gaia Astrometric Solution (TGAS) is the first step in an updated map that will eventually contain a star’s position in 3-D, plus its motion, more accurately than ever before. For now, it contains 2 million stars, measured twice as precisely as by Hipparcos alone. By the end of Gaia’s mission, the Hipparcos data will be superseded by Gaia’s more precise measurements. But in the meantime, Hipparcos — and a few other surprising sources — are lending Gaia a helping hand.
Ladder of the stars
One of Gaia’s big tasks is calibrating the cosmic distance scale, which requires some stellar tools. Astronomers use two types of variable stars, called Cepheid variables and RR Lyrae stars, which brighten and fade on regular timescales. The time they take to brighten and fade scales in an orderly fashion with how intrinsically bright they are. So if two Cepheids have the same period, but one appears fainter, then that star must be farther away. Astronomers can determine its distance by observing its period and brightness.
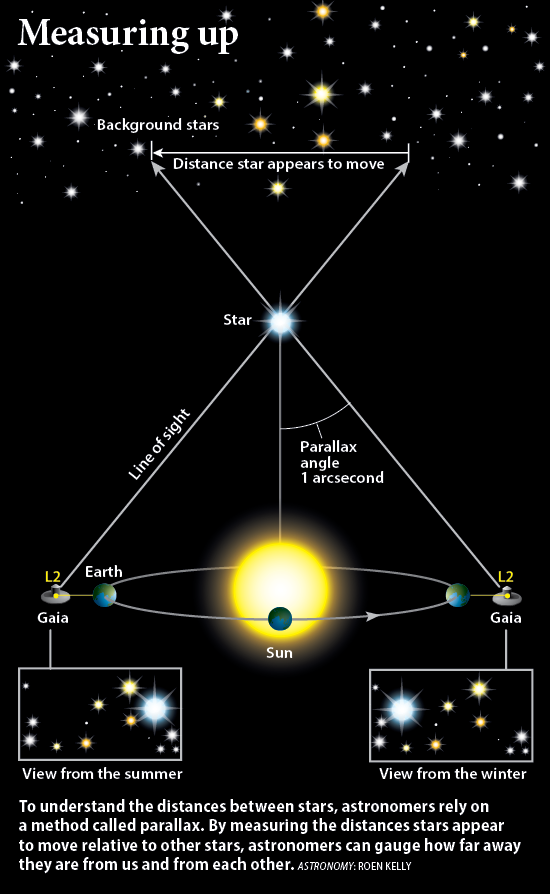
For this system to work, though, astronomers must have a solid understanding of the period-luminosity relationship. To calibrate it, they need to know the distance to some of these variable stars. Gaia will measure the closer stars using parallax, or the apparent change in position of a star due to Earth’s orbital motion around the Sun. A nearby star will appear in front of different background stars during summer, when Earth (and Gaia, orbiting at a stable point behind our planet) is on one side of the solar system, than in winter, when Earth has changed its own position by 2 astronomical units (an astronomical unit is the average Earth-Sun distance).
You can simulate this technique simply by holding a finger in front of your face and looking at it with just your left eye, and then your right. Your finger will appear to change position relative to background objects. So in astronomy, nearby stars have a greater apparent change in position than more distant stars, and this change in apparent position reveals their true distance from Earth. This independent distance measurement enables astronomers to calibrate the period-luminosity relationship of variable stars.
By the end of Gaia’s mission, the correlation should be razor-sharp. Accurately measuring the distance to nearby variable stars and tightening the period-luminosity relationship will enable astronomers to extend this distance ladder to more distant stars, thereby deriving precise distances to faraway variable stars.
First steps
What can astronomers do with a partial Gaia survey? Plenty.
Also, by using the TGAS, astronomers can better understand how stars move, thereby showing them the structure of our galaxy — and some of its neighbors.
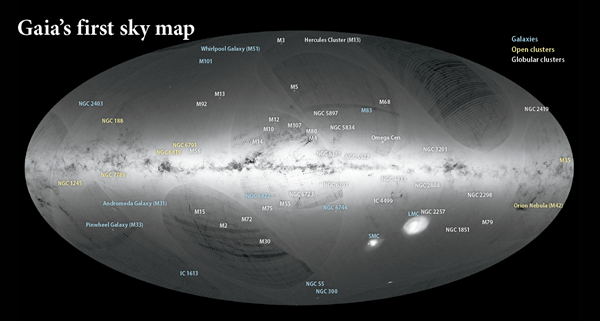
One early surprise Gaia delivered was a stunning image of the Milky Way. “I had asked for this image to be made, but it was much better than I expected,” says Anthony Brown, a member of Gaia’s science team. Brown is also chair of Gaia’s Data Processing and Analysis Consortium, the group that makes Gaia’s reams of data comprehensible to the science community. The image’s clarity and sheer number of targets also suggests that the Milky Way is bigger than previous estimates, though exact numbers will probably wait until later data releases.
More definitively, the Large Magellanic Cloud next door is also bigger than expected. Researchers can study this miniature galaxy from the outside, and Gaia revealed that more stars than expected are tied to its motion across the cosmos. Gisella Clementini, a Gaia team member from Italy, explains, “We’re looking in detail with much more powerful instruments than we had before . . . Even if they’re just behind the corner, because they’re close, you find things.”
One of Gaia’s showier tests was its production of a color-magnitude diagram; plotting stars’ color versus their brightness and where they fall on the diagram tells astronomers about their types and evolutionary stages. Most often, these diagrams are created from astrophysical models of stars rather than real data. But Gaia’s keen vision and measurements have already provided enough data to build a rough diagram, and its full catalog should allow researchers to build a shockingly clear diagram based entirely on data, allowing theorists to hone their models.
Gaia also identified within the Milky Way 1,394 variable stars, which change in brightness over set periods of time. Of these, 386 have not been observed in previous studies. These variable stars are the first wave of targets that will help Gaia with one of its other primary goals.
Surprise events
Even before the first data release, Gaia shared some stellar surprises with the greater community. The data processing team flagged objects of interest meriting quicker investigation, such as erupting stars, black holes, or supernova explosions. Such objects might have quieted down by the time of a formal data release, robbing researchers of the chance to follow up with other telescopes.
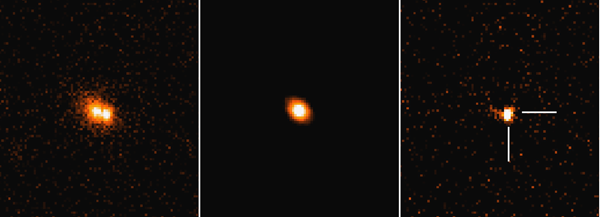
In September 2014, Gaia announced a supernova named Gaia14aaa. Gaia saw the host galaxy grow dramatically brighter between one month and the next, and astronomers quickly followed up with two ground-based telescopes. By studying the spectrum, or light signature, of the galaxy, they determined that the bright light represented a type Ia supernova, when a white dwarf is goaded by a companion star into blowing itself apart.
Another surprising source, named Gaia14aae, flared bright in Gaia’s vision in August 2014. Astronomers eventually determined it was a cataclysmic variable, or a system of two stars cannibalizing each other. The uneven gobbling of material can cause energetic outbursts of light. Both professional and amateur astronomers followed up and discovered that the stars lacked any signature of hydrogen, which forms the bulk of most stars in the universe. Both stars are old and have consumed all their usable hydrogen, putting them in a rare class of cataclysmic variables called AM Canum Venaticorum stars, named for the first system of this type found.
With Gaia’s whole-sky gaze, the survey will continue to turn up transient sources — a few to 10 per day, filtered down from roughly a million potential objects leaping out of a first pass through the data — that the general astronomy community can pursue between data releases.
Freedom of information
David Hogg, a researcher at New York University and a proponent of open access in science, couldn’t be more thrilled. He’s been organizing “hack days” at astronomy conferences for a few years now and has even expanded them to “hack weeks.” In line with more traditional computer programming, hack days — which are more about building things quickly rather than any kind of cyberattack — are designed around the idea that if you put enough smart people into a room to work on focused projects, brilliant ideas and solid results will follow.
Vasily Belokurov from the University of Cambridge pulled an entirely unexpected sub-catalog out of the Gaia release. In the future, Gaia will produce a full catalog of the variable stars that function as priceless tick marks on the cosmic distance scale. So far, this collection is small and confined to a short list that Gaia inventoried early in its mission, but Belokurov says that a much larger catalog is hiding in plain sight.
He used Gaia’s photometric uncertainties to prove that stars with higher uncertainties are actually the variable stars astronomers are waiting for. Although these stars are not officially categorized as such by the Gaia team, Belokurov could compare these Gaia sources to past, fully reduced catalogs, to prove they are real. This should allow astronomers to get a jump-start on data they would otherwise have to wait until the next data release, a year or more away, to see.
Jo Bovy, from the University of Toronto, measured the Oort constants “while he was waiting for files to unzip,” Hogg says, highlighting the fast-paced nature of a science sprint. The Oort constants, named after the same Jan Oort who predicted the Oort Cloud, are two numbers that determine how the Milky Way rotates. They can be measured by looking at large populations of stars in our home galaxy and studying how they move. With the initial release, Bovy recalculated the numbers in a few minutes. “And he got better values than have ever been measured previously,” Hogg says.
Hogg himself is digging into how a star’s movement relative to the disk of the galaxy is tied to its age. Astronomers have known for a long time that stars gain velocity with age, but the exact relationship has been hard to pin down. This is a common problem with stellar age; humans, after all, don’t live long enough to see stars be born and die, and most of astronomers’ age measurements are somewhat vague or rely heavily on models. With Gaia’s precision and its preliminary results, the next generation of astronomers may have accurate ages for stars based solely on their velocities, Hogg says.
Hogg says Gaia isn’t the only massive astronomy project to make its data public. The Kepler mission and the Sloan Digital Sky Survey, among others, made their data publicly accessible, benefiting from outside users turning up hidden gems. When one researcher suggests or requests improvements to how the data is processed or shared, the Gaia mission team can share the benefits with everyone, as well as reap rewards themselves.
Hogg is planning future Gaia sprints: this year in Heidelberg, Germany, and in New York again in 2018. Gaia’s primary mission won’t even complete until 2019. As the catalog matures, Gaia will reveal exoplanets with its radial velocity data, and even sharper views of the Milky Way’s structure.
“So far we’ve seen only the tip of the iceberg,” promises Prusti. With this much fresh science from the first release, we can only wait to see what the full and dazzling picture of our Milky Way reveals.
Korey Haynes is a contributing editor to Astronomy.