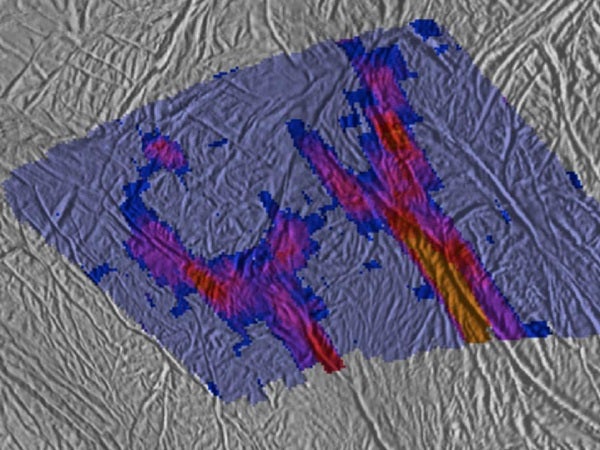
Scientists working jointly with Cassini’s composite infrared spectrometer and its high-resolution imaging camera have constructed the highest resolution heat-intensity maps yet of the hottest part of a region of long fissures spraying water vapor and icy particles from Enceladus. These fissures have been nicknamed “tiger stripes.” Additional high-resolution spectrometer maps of one end of the tiger stripes reveal never-before-seen warm fractures that branch off like split ends from the main tiger stripe trenches. They also show an intriguing warm spot isolated from other active surface fissures.
“The ends of the tiger stripes may be the places where the activity is just getting started, or is winding down, so the complex patterns of heat we see there may give us clues to the life cycle of tiger stripes,” said John Spencer from the Southwest Research Institute in Boulder, Colorado.
The images and maps come from the August 13, 2010, Enceladus flyby, Cassini’s last remote sensing flyby of the moon until 2015. The geometry of the many flybys between now and 2015 will not allow Cassini to do thermal scans like these because the spacecraft will be too close to scan the surface and will not view the south pole. This Enceladus flyby, the 11th of Cassini’s tour, also gave Cassini its last look at any part of the active south polar region in sunlight.
The highest resolution spectrometer scan examined the hottest part of the entire tiger stripe system, part of the fracture called Damascus Sulcus. Scientists used the scan to measure fracture temperatures up to –120° Fahrenheit (–84° Celsius). This temperature appears slightly higher than previously measured temperatures at Damascus, which were around –150°F (–100°C).
Spencer said he isn’t sure if this tiger stripe is just more active than it was the last time Cassini’s spectrometer scanned it in 2008, or if the hottest part of the tiger stripe is so narrow that previous scans averaged its temperature over a larger area. In any case, the new scan had such good resolution, showing details as small as 2,600 feet (800 meters), that scientists could see for the first time warm material flanking the central trench of Damascus, cooling off quickly away from the trench. The Damascus thermal scan also shows large variations in heat output within a few miles along the length of the fracture. This unprecedented resolution will help scientists understand how the tiger stripes deliver heat to the surface of Enceladus.
Cassini acquired the thermal map of Damascus simultaneously with a visible-light image where the tiger stripe is lit by sunlight reflecting off Saturn. The visible-light and thermal data were merged to help scientists understand the relationships between physical heat processes and surface geology.
“Our high-resolution images show that this section of Damascus Sulcus is among the most structurally complex and tectonically dynamic of the tiger stripes,” said Paul Helfenstein from Cornell University, Ithaca, New York. Some details in the appearance of the landforms, such as a peculiar pattern of curving striations along the flanks of Damascus, had not previously been noticed in ordinary sunlit images.
The day after the Enceladus flyby, Cassini swooped by the icy moon Tethys, collecting images that helped fill in gaps in the Tethys global map. Cassini’s new views of the heavily cratered moon will help scientists understand how tectonic forces, impact cratering, and perhaps even ancient resurfacing events have shaped the moon’s appearance.