On Earth, lake levels rise and fall with the seasons and with long-term climate changes as precipitation, evaporation, and runoff add and remove liquid. Now, for the first time, scientists have found compelling evidence for similar lake-level changes on Saturn’s largest moon, Titan — the only other place in the solar system seen to have a hydrological cycle with standing liquid on the surface.
Using data gathered by NASA’s Cassini spacecraft over a span of 4 years, the researchers led by Alexander G. Hayes and Oded Aharonson from the California Institute of Technology (Caltech) have obtained two separate lines of evidence showing roughly a 3-foot (1 meter) per year drop in the levels of lakes in Titan’s southern hemisphere. The decrease is the result of the seasonal evaporation of liquid methane from the lakes, which, because of Titan’s frigid temperatures, are composed largely of liquid methane, ethane, and propane.
“It’s really exciting because on this distant object we’re able to see this meter-scale drop in lake depth,” said Hayes. “We didn’t know Cassini would even be able to see these things.”
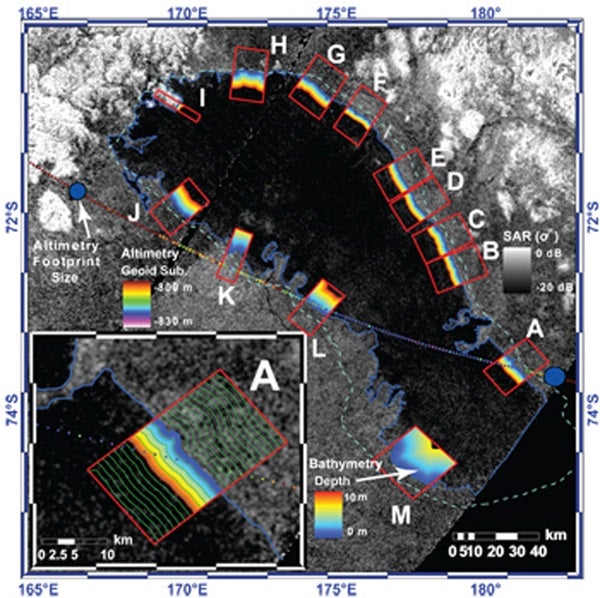
One of the lakes, Ontario Lacus, is the southern hemisphere’s largest lake, and it was the first lake scientists observed on the moon. Hayes, Aharonson, and their colleagues report that the shoreline of Ontario Lacus receded by about 6 miles (10 kilometers) from June 2005 to July 2009, a period of time that represents mid-summer to fall in Titan’s southern hemisphere — one Titan year lasts 29.5 Earth years.)
Ontario Lacus and other southern hemisphere lakes were analyzed using Synthetic Aperture Radar (SAR) image data from the Cassini spacecraft. In radar data, smooth features, such as lakes, appear as dark areas, while rougher features, such as mountain belts, appear bright. The intensity of the radar backscatter provides information about the composition and roughness of surface features. In addition to the SAR data, radar altimetry — which measures the time it takes for microwave signals bouncing off a surface to arrive back at the spacecraft — was collected across a transect of Ontario Lacus in December 2008.
“The combination of SAR and altimetry measurements across the transect gave information about the absorptive properties of the liquid, and argues that the liquids are relatively pure hydrocarbons made up of methane and ethane and not a gunky tar,” Aharonson said.
“The liquid is not highly attenuating, which means it is fairly clear to radar energy — that is, transparent, like liquid natural gas,” said Hayes. “Because of this, radar can see through the liquid in Titan’s lakes to a depth of several meters. Then the radar hits the floor, and bounces back. Or, if the lake is deeper than a few meters, the radar is completely absorbed, producing a ‘black’ signature.”
Once the liquid’s optical properties were known, the researchers could use the radar data to “see” the lakebed underneath the liquid — at least down to the depth where the signal is completely attenuated. “How far offshore you can see is determined by the local slope of the lakebed, or bathymetry,” said Hayes. “This gave us the ability to take changes in radar signals and convert them to depths,” and thus to calculate the slope of the lakebed around the entire lake.
“We were able to determine the bathymetry of the lake out to a depth of about 26 feet (8 meters),” Hayes said. The lake is shallowest and most gently sloped along its southern edge in areas where sediment is accumulating. Along its eastern shore, the slope of the lake is somewhat steeper. “This is what we are calling the ‘beachhead,'” Hayes said. The slope is very steep along the lake’s northern boundary where it butts up against a range of mountains. “The slope changes we see are consistent with the geology around the lake,” said Hayes.
The researchers compared lake images obtained 4 years apart, and they found that Ontario had shrunk. “The extent to which the lake has receded is related to the slope, where the lake is shallow, the liquid will have receded more,” Hayes said. “This allows us to deduce the vertical height by which the lake depth has dropped, which is about 3 feet (1 meter) per year.”
The researchers also analyzed the evaporation of methane from nearby lakes by comparing the radar signatures of these lakes as measured in December 2007 with data obtained in May 2009. Over that period, the “apparent darkness” of the lakes, indicating the presence of a radar-attenuating liquid, either decreased or disappeared entirely, which means that their liquid levels had been reduced. The researchers were able to calculate the drop in lake depth, “and we got the same result: 3 feet (1 meter) per year of liquid loss,” Aharonson said. Lakes in Titan’s northern hemisphere, which is now entering spring, have also been covered multiple times by radar instruments, but so far no analogous changes have been conclusively detected.
That doesn’t mean the changes haven’t occurred, however. “We would expect it will happen, but we don’t know how it would manifest in the data if the lakes in the north are significantly deeper. We’ll continue to look for this effect with future radar images to disentangle the seasonal variations from longer-term climate variations we previously have proposed.” Aharonson said.