Key Takeaways:
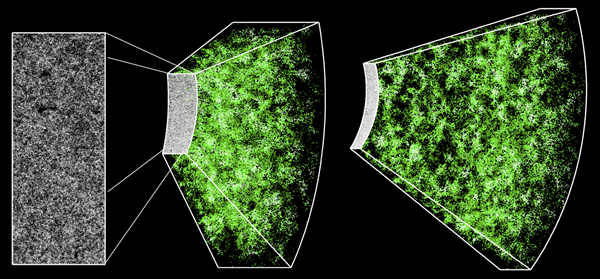
In the quest for dark energy, astronomers have created an unprecedented 3D map of 1.2 million galaxies in a volume of about 650 cubic billion light years.
Hundreds of astronomers from the Sloan Digital Sky Survey III (SDSS-III) and the Max Planck Institutes for Extraterrestrial Physics (MPE) and for Astrophysics (MPA) contributed to this map. The astronomers found that the map agrees with the current cosmological model (the Lambda Cold Dark Matter model) and confirmed that dark energy is a cosmological constant.
Understanding how dark energy interacts and affects our universe is crucial to unraveling how the universe came to be and how it may end. Dark energy is believed to be what contradicts the force of gravity and is what is accelerating the expansion of the universe. With the creation of this three-dimensional map of 1.2 million galaxies, astronomers may be getting closer to finding an answer to the nature of dark energy. These findings were submitted to the Monthly Notices of the Royal Astronomical Society (MNRAS) as a collection of papers. (Preprints are available here, here, here, here, and here.)
“We have spent a decade collecting measurements of 1.2 million galaxies over one quarter of the sky to map out the structure of the universe over a volume of 650 cubic billion light-years,” says Dr. Jeremy Tinker of New York University in a press release.
The Baryon Oscillation Spectroscopic Survey (BOSS) of the SDSS-III carried out the precise measurements found. By studying the tugs between dark energy and dark matter, the scientists were able to determine the Baryonic Acoustic Oscillation (BAO) between the galaxies in the map to measure the expansion rate of the universe.
The normal BAO size is found from pressure waves that traveled throughout the universe when it was only 400,000 years old (the universe is currently 13.8 billion years old). These waves then became frozen in the matter distribution throughout the universe. All galaxies are therefore separated preferentially by a characteristic distance in what is called the BAO scale.
Using observations from the cosmic microwave background (CMB), the size of the acoustic scale at the universe’s current age can be determined. This is because the light that is emitted corresponds to when the pressure waves became frozen. Seeing how the distribution of galaxies has changed since then can give astronomers clues to how the dark energy and dark matter have battled over the expansion rate of the universe. Ariel Sanchez, from MPE was the astronomer, led the search to find the total amounts of dark energy and dark matter in the universe.
“Measuring the acoustic scale across cosmic history gives a direct ruler with which to measure the universe’s expansion rate,” says Sanchez in the same press release. “ With BOSS, we have traced the BAO’s subtle imprint on the distribution of galaxies spanning a range of time from 2 to 7 billion years ago.”
These very precise measurements had to be analyzed many times, specifically the distances to the galaxies in the map. Using a spectrometer, the light from a galaxy appears red-shifted as it is moving away from us. The red-shift in light is how the astronomers were able to correlate the galaxy’s distance from Earth; the farther a galaxy is, the faster it moves and therefore the more it is red-shifted. Dr. Shun Saito from MPA contributed models to the BOSS data analysis.
“However, galaxies also have peculiar motions and the peculiar velocity component along the line-of-sight leads to the so-called redshift space distortion,” says Saito in the same press release. “This makes the galaxy distribution anisotropic because the line-of-sight direction is now special — only along this direction the distance is measured through a redshift, which is contaminated by peculiar velocity. In other words, the characteristic anisotropic pattern allows us to measure the peculiar velocity of galaxies — and because the motion of galaxies is governed by gravity, we can use this measurement to constrain to what level Einstein’s general relativity is correct at cosmological scales. In order to properly interpret the data, we have developed a refined model to describe the galaxy distribution.”
Another possible approach is to use the angular positions of the galaxies in the sky rather than the 3D physical positions in the universe.
“This method uses only observables,” says Dr. Salvador Salazar, a junior MPE researcher, in the same press release. “We make no prior assumptions about the cosmological model.”
Many approaches have been used to try and analyze the huge BOSS data set. “We now have seven measurements, which are slightly different, but highly correlated,” Sanchez says in a press release. “To extract the most information about the cosmological parameters, we had to find not only the best methods and models for data analysis but also the optimal combination of these measurements.”
Their strenuous efforts have paid off as the BOSS data show that dark energy is what is causing the expansion with an error of only 5 percent in the cosmological constant found. The cosmological constant is called Lambda, as coined by Albert Einstein as a repellant effect in the universe. These findings are still consistent with the relatively young theory of the cosmological model.
The map also reveals that galaxies tend to move to areas with more matter, staying true to the laws of gravity as well as the infall of material following the laws of general relativity. This suggests that the idea of the expansion of the universe is caused by a phenomenon like dark energy that works on large cosmic scales and not our theories of gravity breaking down.