Dust and gas, making up the interstellar medium (ISM), fill space between stars in galaxies. The dust in the ISM is shaped by turbulent flows that form intricate fractal structures on scales ranging from thousands of light-years down to hundreds of kilometers. Rather than measuring the dust itself to create the map, the team has used observations of more than 38 million stars to estimate how much starlight has been obscured by the ISM and thus how much dust lies in our line of sight to each star. This “extinction” map derives from the newly released catalog of the Isaac Newton Telescope Photometric H-alpha Survey of the Northern Galactic Plane (IPHAS), the first digital survey to cover the entire northern Milky Way.
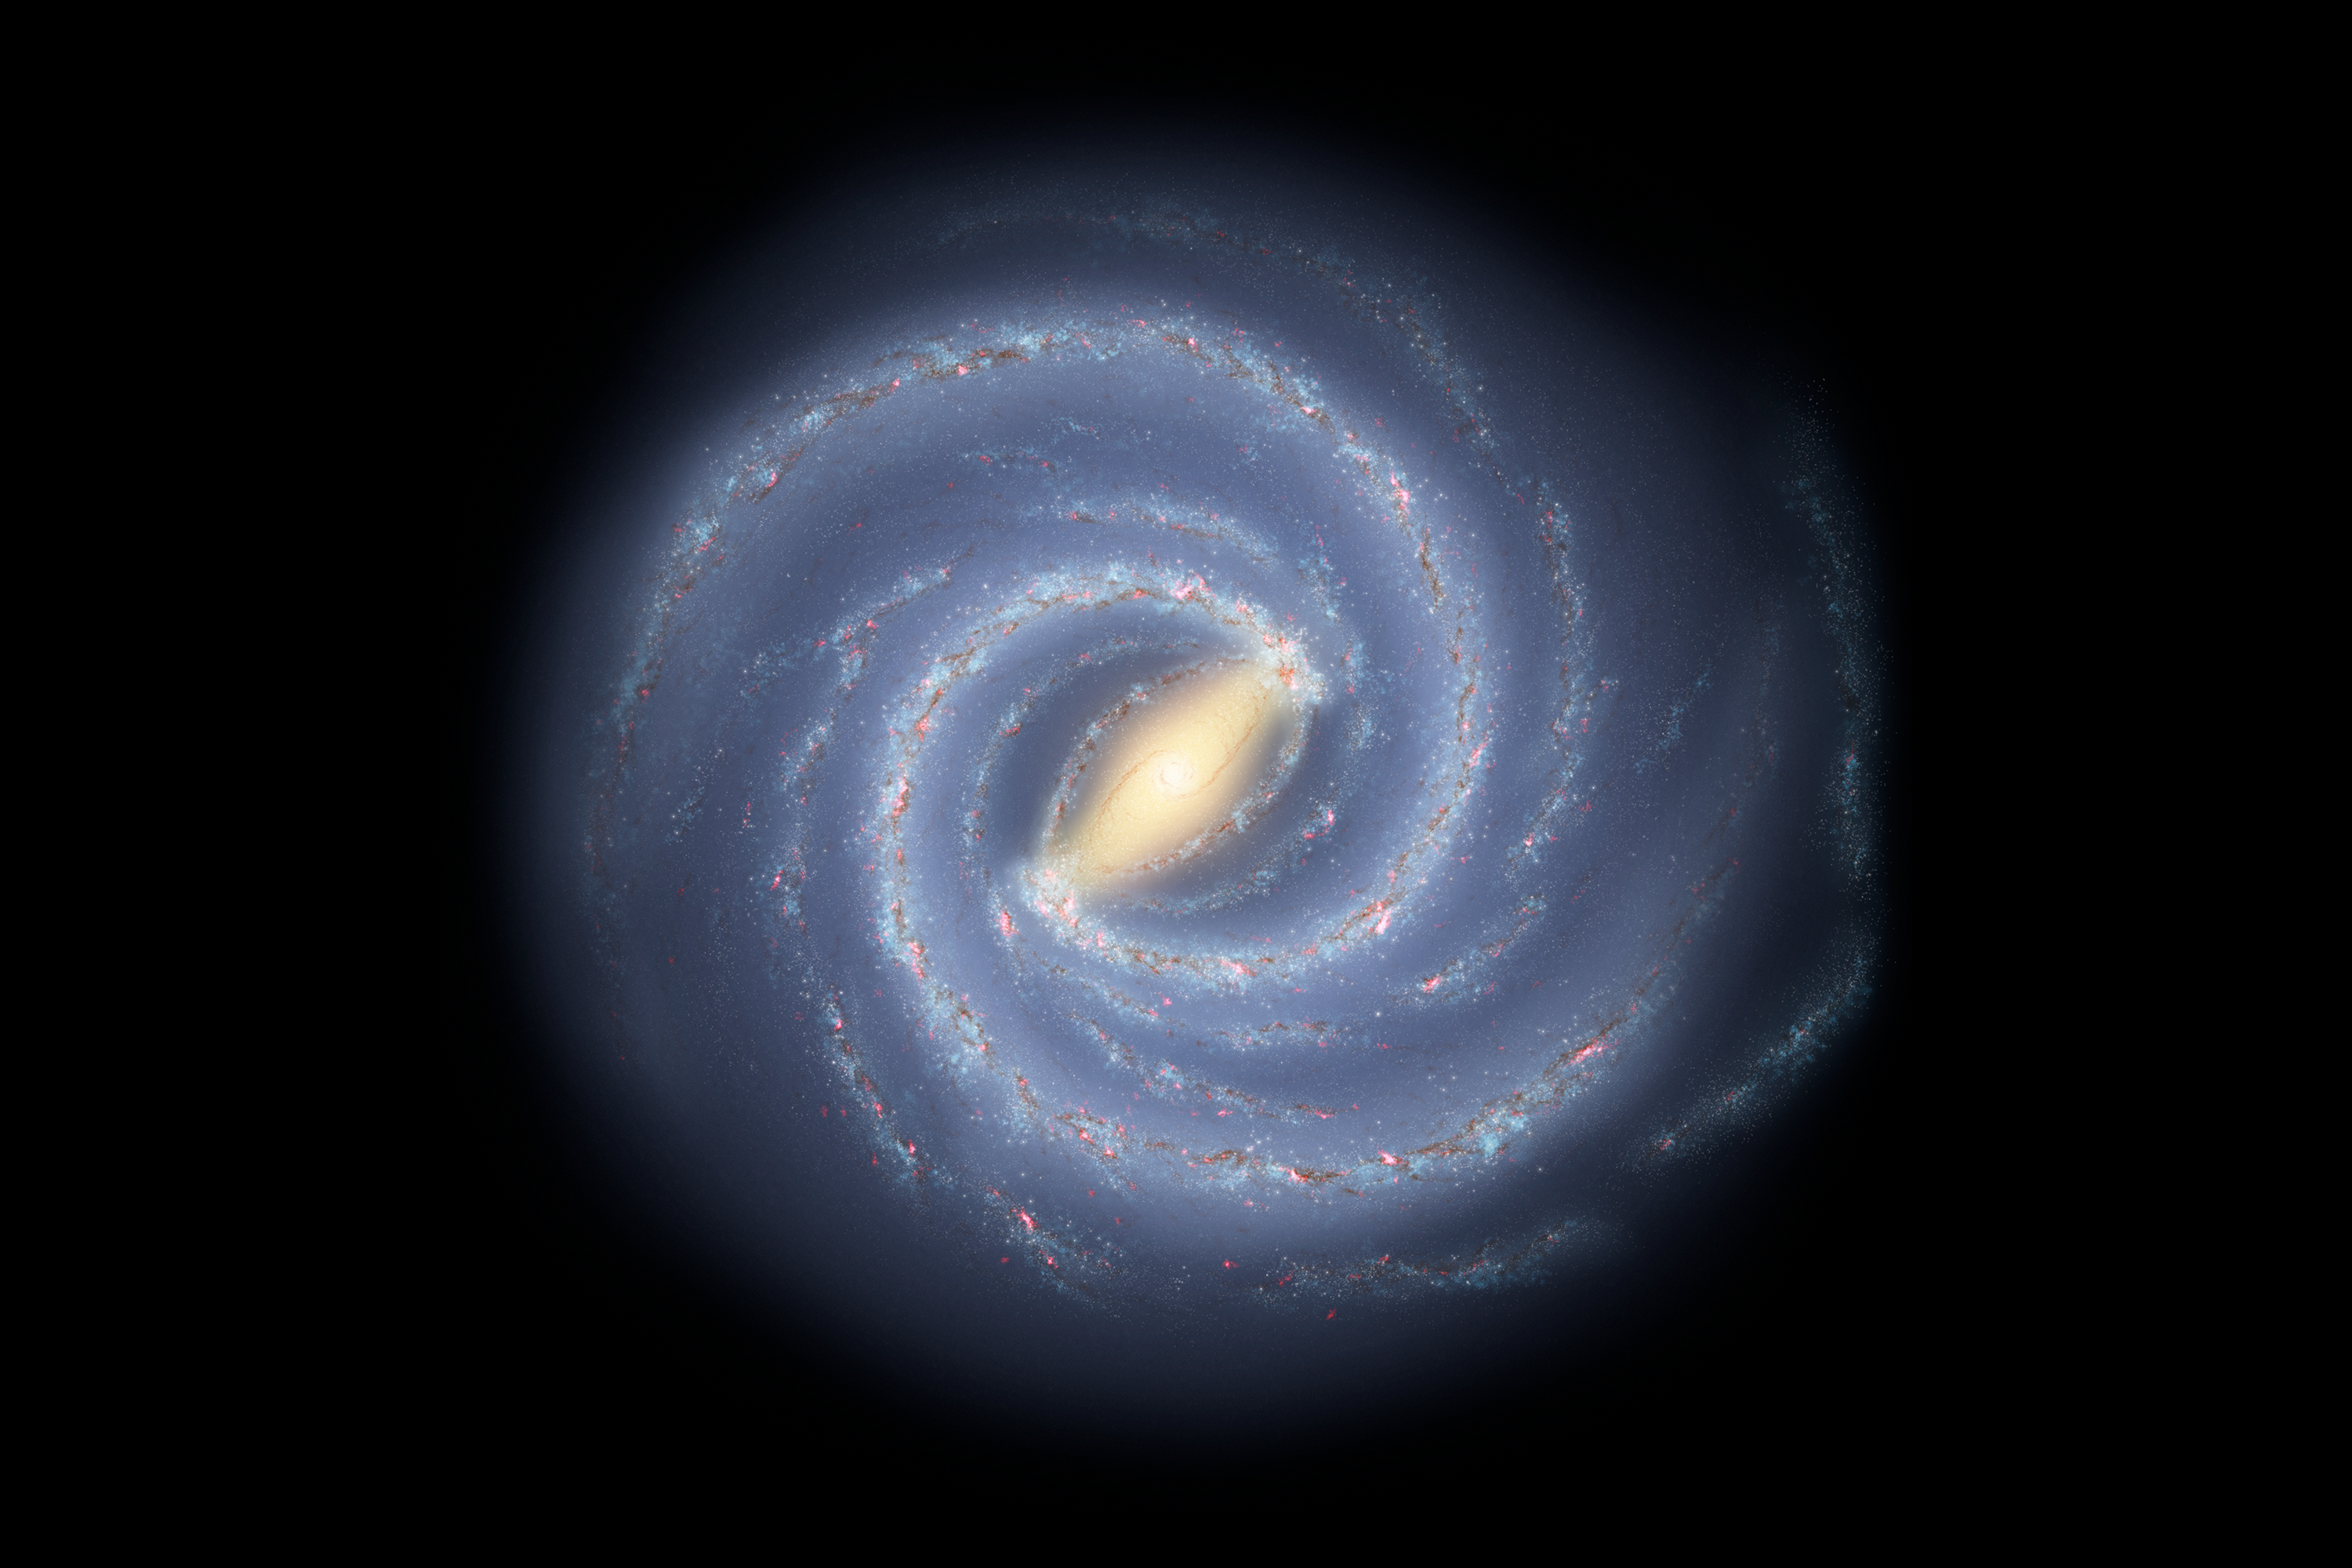
“Because the solar system is embedded in the disk of the Milky Way, our view of it is choked with dust, with the result we know less about its internal structure than we do about some external galaxies, such as M31 in Andromeda, “ said Janet Drew of the University of Hertfordshire. “In this northern survey, we are mainly looking at the parts of the galactic disk that lie outside the Sun’s orbit around the galactic center. This 3-D map demonstrates with greater force than existing 2-D maps that dust in the outer disk does not trace the Perseus spiral arm and other expected structures in a simple way.”
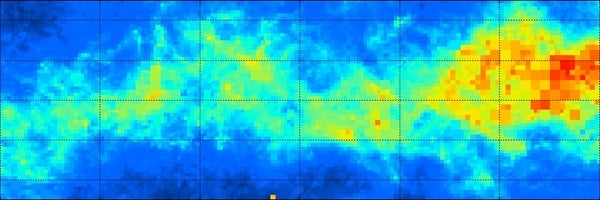
The map shows how extinction builds with distance away from the Sun — typically out to 12,000 light-years or more — in any part of the surveyed northern Milky Way. Detail on an angular scale seven times finer than the angular size of the Moon is caught. The fractal nature of the ISM is visible in the map, as are large-scale features, such as star-forming molecular clouds and bubbles of ionized gas around clusters of hot stars.
“We can see a number of specific features, including the Rosette Nebula and the star-forming belt in the Perseus Arm of the Milky Way,” said Stuart Sale, who led the team that created the map. “Our location within the Milky Way means that we can study the ISM in far greater detail than for any other galaxy. The knowledge that we gain from studying our galaxy can subsequently be applied to others.”
“IPHAS has been a major part of the Isaac Newton Telescope’s program of observation over the last decade,” said Drew. “It is one of several ground-based surveys beginning to provide important new and very large collections of data, complementing the European Space Agency’s Gaia mission as it starts its work, that are being discussed at NAM 2014 [the Royal Astronomical Society’s National Astronomy Meeting]. The common goal is to properly unravel the full 3-D spatial organization of our own galaxy.”