The Wide-Field Infrared Survey Explorer space telescope jettisons its cover


Artist’s concept of NASA’s Wide-field Infrared Survey Explorer.
NASA/JPL
December 30, 2009
NASA’s recently launched Wide-Field Infrared Survey Explorer ejected its protective cover and opened its eyes to the starry sky today.
NASA’s recently launched Wide-Field Infrared Survey Explorer ejected its protective cover and opened its eyes to the starry sky today.
Engineers and scientists say the maneuver went off without a hitch, and everything is working properly. The mission’s “first-light” images of the sky will be released to the public in about a month after the telescope is calibrated.
“The cover floated away as we planned,” said William Irace, the mission’s project manager at NASA’s Jet Propulsion Laboratory (JPL), Pasadena, California. “Our detectors are soaking up starlight for the first time.”
WISE will perform the most detailed infrared survey of the entire sky to date. Its millions of images will expose the dark side of the cosmos — objects such as asteroids, stars, and galaxies that are too cool or dusty to be seen with visible light. The telescope will survey the sky 1.5 times in 9 months, ending its primary mission when the coolant it needs to see infrared light evaporates.
WISE launched December 14 from Vandenberg Air Force Base in California. Once it was thoroughly checked out in space, it was ready to “flip its lid.”
The cover served as the top to a Thermos-like bottle that chilled the instrument — a16-inch (40-centimeter) telescope and four infrared detector arrays with one million pixels each. The instrument must be maintained at frosty temperatures, as cold as -447° Fahrenheit (-266° Celsius), to prevent it from picking up its own heat, or infrared glow. The cover kept everything cool on the ground by sealing a vacuum space in the instrument chamber. In the same way that Thermos bottles use thin vacuum layers to keep your coffee warm or iced tea cold, the vacuum space inside WISE stopped heat from getting in. Now, space itself will provide the instrument with an even better vacuum than before.
The cover also protected the instrument from stray sunlight and extra heat during launch.
At about 5:30 p.m. EST December 29, engineers sent a command to fire pyrotechnic devices that released nuts holding the cover in place. Three springs were then free to push the cover away and into an orbit closer to Earth than that of the spacecraft.
Scientists and engineers are now busy adjusting the rate of the spacecraft to match the rate of a scanning mirror. To take still images on the sky as it orbits around Earth, WISE will use a scan mirror to counteract its motion. Light from the moving telescope’s primary mirror will be focused onto the scan mirror that will move in the opposite direction at the same rate. This allows the mission to take freeze-frame snapshots of the sky every 11 seconds. That’s about 7,500 images a day.
“It’s wonderful to end the year with open WISE eyes,” said Peter Eisenhardt, the mission’s project scientist at JPL. “Now we can synch WISE up to our scan mirror and get on with the business of exploring the infrared universe.”
WISE is scheduled to begin its survey of the infrared heavens mid-January of 2010.
Three finalists for future space science mission: Venus, an asteroid, the Moon

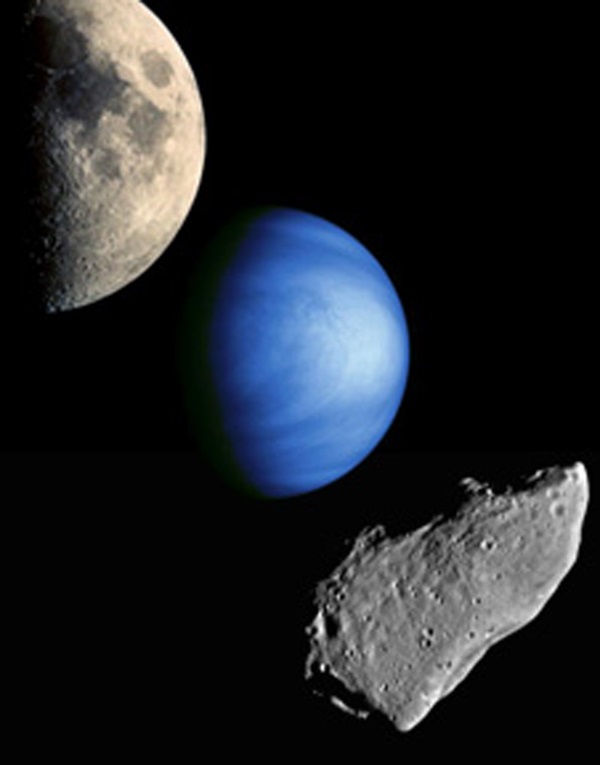
From top to bottom, pictured (not to scale) are the Moon, Venus, and an asteroid. These three celestial bodies from our solar system are possible candidates for NASA’s next space venture.
NASA
December 30, 2009
NASA has selected three proposals as candidates for the agency’s next space venture to another celestial body in our solar system. The final project selected in mid-2011 may provide a better understanding of Earth’s formation or perhaps the origin of life on our planet.
NASA has selected three proposals as candidates for the agency’s next space venture to another celestial body in our solar system. The final project selected in mid-2011 may provide a better understanding of Earth’s formation or perhaps the origin of life on our planet.
The proposed missions would probe the atmosphere and crust of Venus; return a piece of a near-Earth asteroid for analysis; or drop a robotic lander into a basin at the Moon’s south pole to return lunar rocks back to Earth for study.
NASA will select one proposal for full development after detailed mission concept studies are completed and reviewed. The studies begin in 2010, and the selected mission must be ready for launch no later than December 30, 2018. Mission cost, excluding the launch vehicle, is limited to $650 million.
“These are projects that inspire and excite young scientists, engineers, and the public,” said Ed Weiler, associate administrator for the Science Mission Directorate at NASA headquarters in Washington. “These three proposals provide the best science value among eight submitted to NASA this year.”
Each proposal team initially will receive approximately $3.3 million in 2010 to conduct a 12-month mission concept study that focuses on implementation feasibility, cost, management, and technical plans. Studies also will include plans for educational outreach and small business opportunities.
The selected proposals are:
The Surface and Atmosphere Geochemical Explorer (SAGE) mission to Venus would release a probe to descend through the planet’s atmosphere. During descent, instruments would conduct extensive measurements of the atmosphere’s composition and obtain meteorological data. The probe then would land on the surface of Venus, and its abrading tool would expose both a weathered and a pristine surface area to measure its composition and mineralogy. Scientists hope to understand the origin of Venus and why it is so different from Earth.
The Origins Spectral Interpretation Resource Identification Security Regolith Explorer spacecraft, called Osiris-Rex, would rendezvous and orbit a primitive asteroid. After extensive measurements, instruments would collect more than two ounces of material from the asteroid’s surface for return to Earth. The returned samples would help scientists better understand and answer long-held questions about the formation of our solar system and the origin of complex molecules necessary for life.
MoonRise: Lunar South Pole-Aitken Basin Sample Return Mission would place a lander in a broad basin near the Moon’s south pole and return approximately two pounds of lunar materials for study. This region of the lunar surface is believed to harbor rocks excavated from the Moon’s mantle. The samples would provide new insight into the early history of the Earth-Moon system.
The proposals were submitted to NASA July 31, 2009, in response to the New Frontiers Program 2009 Announcement of Opportunity. New Frontiers seeks to explore the solar system with frequent, medium-class spacecraft missions that will conduct high-quality, focused scientific investigations designed to enhance understanding of the solar system.
The final selection will become the third mission in the program. New Horizons, NASA’s first New Frontiers mission, launched in 2006, will fly by the Pluto-Charon system in 2015 then target another Kuiper Belt object for study. The second mission, called Juno, is designed to orbit Jupiter from pole to pole for the first time, conducting an in-depth study of the giant planet’s atmosphere and interior. It is slated for launch in August 2011.
Explore Scientific’s 5-inch apochromatic refractor
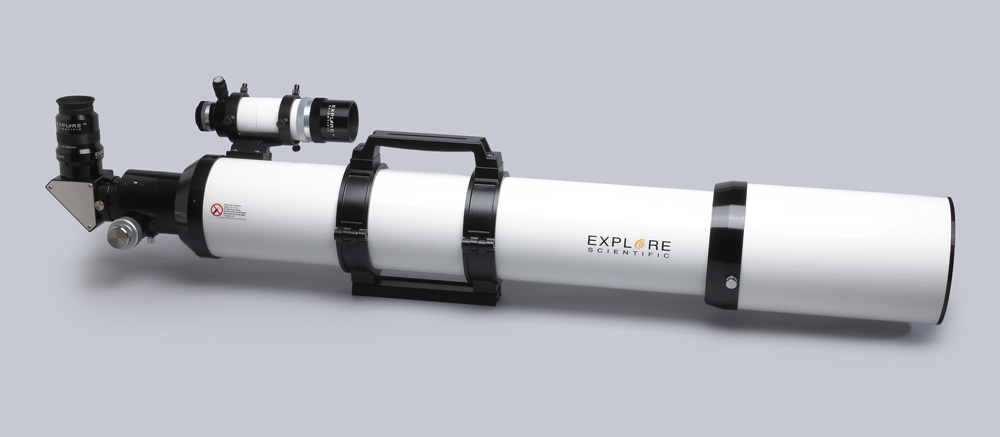

Explore Scientific’s 127mm f/7.5 Air-Spaced Triplet ED APO features a well-thought-out design that includes a carrying handle.
Astronomy: William Zuback
This review, “Explore Scientific’s 5-inch APO combines power and portability,” appeared in the February 2010 issue of Astronomy magazine
I’ll admit it: I love apochromatic (APO) refractors. Although I grew up using reflectors, I have developed an appreciation for the image through a high-quality APO. So when a new one appears, it catches my interest.
Explore Scientific, based in Laguna Hills, California, introduced its APO series at the 2009 Winter Star Party. I was eager to look through them there, and when the opportunity to evaluate the 127mm (5-inch) f/7.5 Air-Spaced Triplet ED APO arose, I jumped at it.
To continue reading this review you need to be an Astronomy magazine subscriber.
Subscribers have full access to our equipment review archive and many other great online benefits.
Already a subscriber? Simply log in or create an account below.
Lunar eclipse ends the year for parts of the world
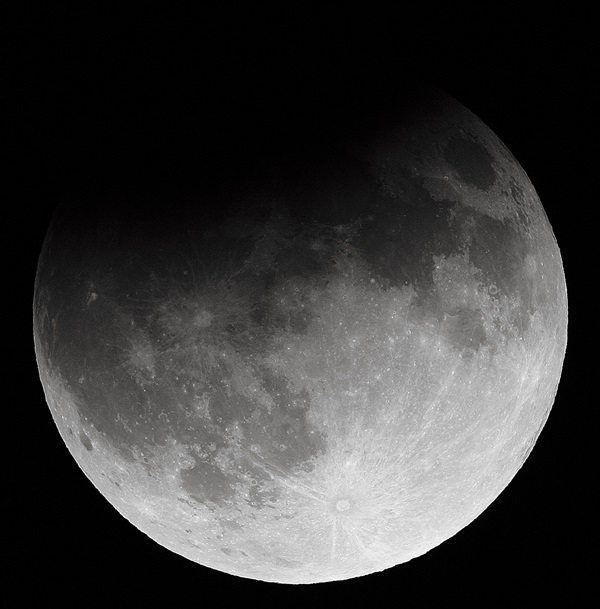
Earth’s shadow covered the Moon’s north pole during this September 2006 eclipse. On December 31, our shadow kisses the lunar south pole.
Anthony Ayiomamitis
On December 31, the Moon will undergo a partial lunar eclipse. This eclipse is considered “partial” because Earth’s umbral shadow — the shadow’s darkest part — will cover only 8 percent of the Moon at maximum. But the entire face of the Moon will pass through the lighter penumbra and turn a light gray.
A lunar eclipse occurs when the Sun, Earth, and Full Moon align in that order. Viewers can expect to see a bite taken out of the Full Moon’s southern limb, while the rest of the disk takes on a more grayish hue than normal.
Residents of Europe, Asia, Africa, and Australia will get the best views. In North America, those in the far northeast will see the end of the eclipse, and those in the far northwest will see the eclipse begin.
The eclipse will begin at 17h17m Universal Time (12:17 p.m. EST). It will take 4 hours and 11 minutes for the Moon to pass through Earth’s shadow completely. Maximum will occur at 19h23m UT (2:23 p.m. EST, 10:23 a.m. AKST).
The next partial lunar eclipse will occur June 26, 2010, and the next total lunar eclipse will be December 21, 2010.
Eclipse begins: 12:17 p.m. EST, 8:17 a.m. AKST
Umbral eclipse begins: 1:52 p.m. EST, 9:52 a.m. AKST
Mideclipse: 2:23 p.m. EST, 10:23 a.m. AKST
Umbral eclipse ends: 2:52 p.m. EST, 10:52 a.m. AKST
Eclipse ends: 4:28 p.m. EST, 12:28 p.m. AKST

Additional online observing tools from Astronomy magazine
- Locate the Moon in your night sky with Astronomy.com’s interactive star chart: StarDome
- View and post eclipse images in our Online Reader Gallery
- Sign up to receive Astronomy‘s FREE weekly e-mail newsletter!
Have astronomers seen massive young clusters like the Milky Way’s Arches Cluster in other spiral galaxies?


This is a NASA Hubble Space Telescope image of the Antennae galaxies. During the course of the collision, billions of stars will be formed. The brightest and most compact of these star birth regions are called super star clusters.
NASA/ESA/the Hubble Heritage Team (STScI/AURA)/ESA
Yes. These clusters are harder to find in distant galaxies, but locating them is possible with modern observatories.
Long views of Mars and Saturn

Venus and Jupiter slide past each other in mid-February. The two objects shine brilliantly but will be hard to spot, even through binoculars, in the bright twilight shortly after sunset.
Astronomy: Roen Kelly
Several major planets, and at least one minor one (the asteroid Vesta), give solar system observers plenty of targets for a night under the stars. The two brightest objects — Venus and Jupiter — pass close to each other low in evening twilight in mid-February.
Ask Astro web extra: Our Sun appears yellow, but the sky isn’t. Why?
What’s that meteorite?
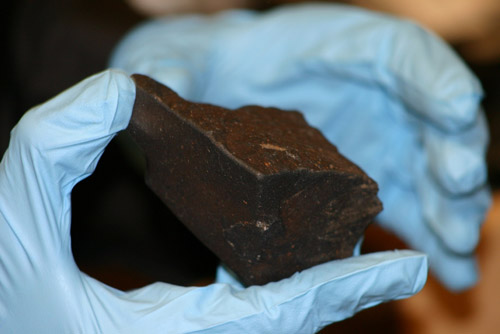

The Plainview meteorite is an unmelted stony meteorite, or chondrite. It is unusual among stony meteorites because its makeup includes 20 percent iron. It was found in Texas in 1917.
Astronomy: Michael E. Bakich
In Astronomy‘s February 2010 issue, Raymond Shubinski’s story, “How to start a meteorite collection,” discussed dealers, ethics, and collectors. We didn’t have the space to talk about meteorites themselves, however, but this PDF file will help you make sense of all the strange-sounding classes.
See Dave Eicher’s favorite deep-sky objects (part 2)
Bob Berman’s Strange Universe: Why is Neptune so ugly?

We’re attracted to astronomy for many reasons. It’s heady. Mysterious. Awesome. Some of us happily go broke buying fabulous telescopes and gadgets. Some enjoy the math. Yet one major aspect produces no science and little official discussion: beauty.
Glenn Chaple’s Observing Basics: Astroimaging 101

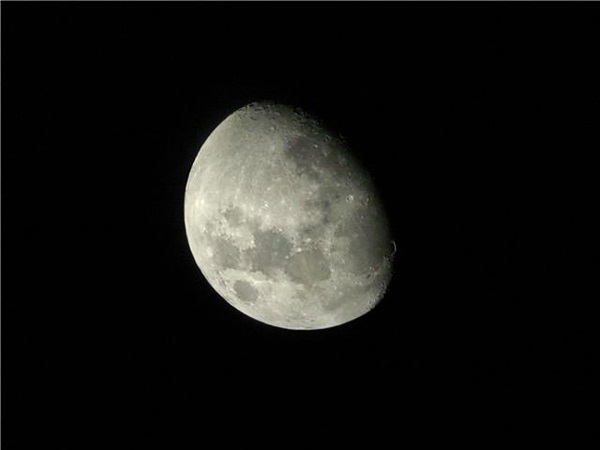
The author captured this image of a waxing gibbous Moon August 30, 2009. He used a Canon PowerShot A640 with Orion Skyquest 4.5-inch reflector.
Glenn Chaple
This column traces its roots to the January 2002 issue of Astronomy. Under the name “Beginner’s Sky: Diary of a neophyte astronomer,” author Jerry Burstein chronicled his adventures as a newcomer to backyard astronomy. Upon inheriting Jerry’s column, I approached it from a different angle — that of a veteran observer passing on helpful hints to the novice.