Youngest forming planet discovered

HL Tau
The false color image is a map of the radio emission (at a wavelength of 1.3 cm) emitted from the region around the star HL Tau. The candidate protoplanet is marked b. The bar at top left (marked 50 AU) indicates 50 times the Earth-Sun distance on the same scale, or about the size of the orbit of Pluto. HL Tau is located in the center of the image. The star is surrounded by a dusty disc tilted to the line of sight; only the inner part is visible here but its extent is indicated by the white ellipse. The arrows show the direction of the jets of hot gas emitted as overspill from the star growth process.
VLA/Pie Town antenna
April 2, 2008
Using radio observatories in the UK and US and computer simulations, a team of astronomers has identified the youngest forming planet yet seen. Team leader Jane Greaves of the University of St. Andrews will discuss this new protoplanet in her talk at the RAS National Astronomy Meeting in Belfast on Wednesday April 2.

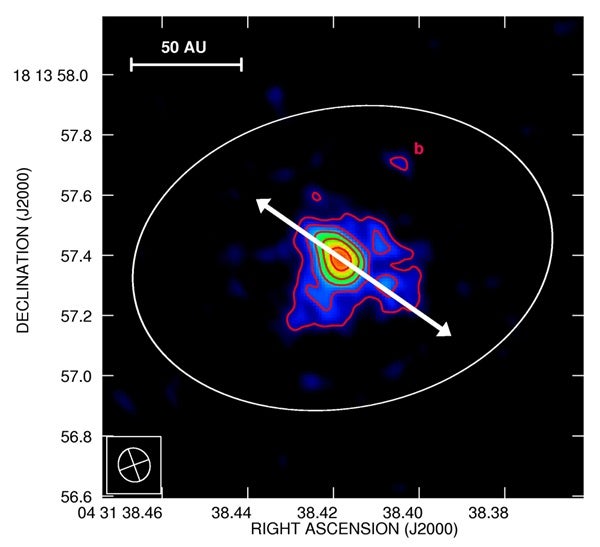
Taking advantage of a rare opportunity to use the Very Large Array (VLA) of radio telescopes in the U.S. with the special addition of an extra telescope 50 kilometers away, the team studied the disk of gas and rocky particles around the star HL Tau. This star is thought to be less than 100,000 years old (by comparison the Sun is 4,600 million years old) and lies in the direction of the constellation of Taurus at a distance of 520 light-years. The disk around HL Tau is unusually massive and bright, which makes it an excellent place to search for signs of forming planets.

The VLA gives very sharp images of HL Tau and its surroundings. The team studied the system using radio emission at a wavelength of 1.3 cm, specifically chosen to search for the emission from super-large rocky particles about the size of pebbles. The presence of these pebbles is a clue that rocky material is beginning to clump together to form planets.

In the UK, scientists used the MERLIN array of radio telescopes centered on Jodrell Bank in Cheshire, to study the same system at longer wavelengths. This allowed the astronomers to confirm that the emission is from rocks and not from other sources such as hot gas. Jodrell Bank scientists Anita Richards and Tom Muxlow analyzed the data.

computer simulation of HL Tau
This is an image from the computer simulation of HL Tau and its surrounding disk. In the model the dense clump (seen here at top right) forms with a mass of about 8 times that of Jupiter at a distance from the star about 75 times that from the Earth to the Sun.
Ken Rice/Royal Observatory Edinburgh
The big surprise was that, as well as detecting super-large dust in the disk around HL Tau, an extra bright clump was seen in the image. It confirms tentative nebulosity reported a few years earlier at around the same position, by a team lead by Jack Welch of the Berkeley-Illinois-Maryland Array. The new image shows the same system in much greater detail.

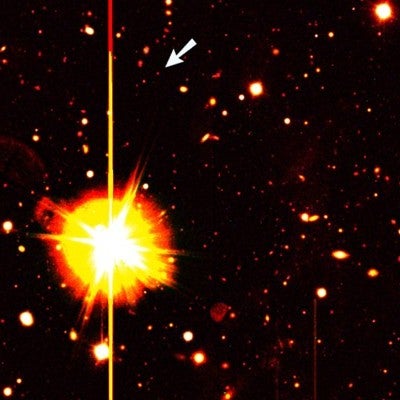
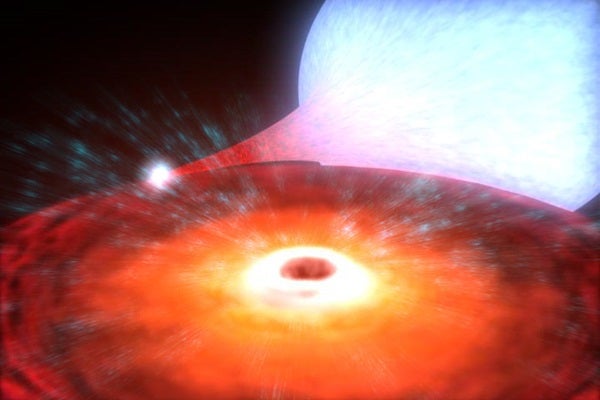
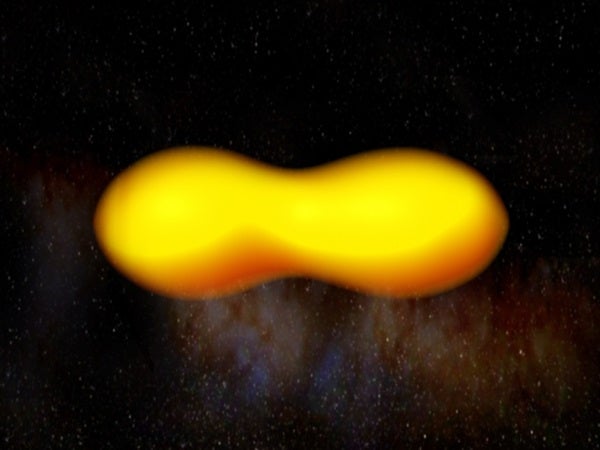
Greaves comments, “We see a distinct orbiting ball of gas and dust, which is exactly how a very young protoplanet should look. In the future, we would expect this to condense out into a gas giant planet like a massive version of Jupiter. The protoplanet is about 14 times as massive as Jupiter and is about twice as far from HL Tau as Neptune is from our Sun.”

Richards adds, “The new object, designated HL Tau b, is the youngest planetary object ever seen and is just 1 percent as old as the young planet found in orbit around the star TW Hydrae that made the news last year. HL Tau b gives a unique view of how planets take shape, because the VLA image also shows the parent disk material from which it formed.”

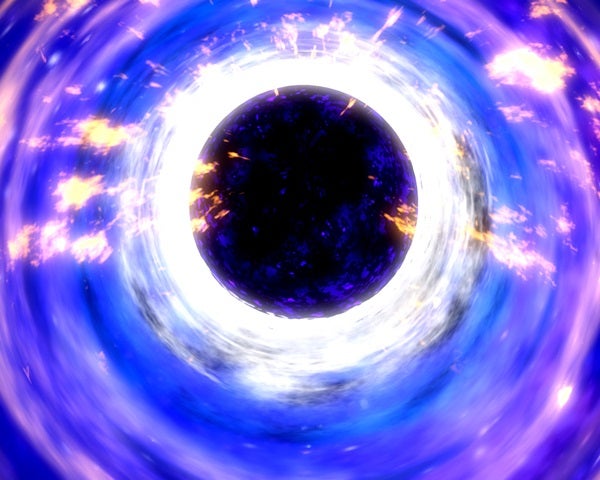
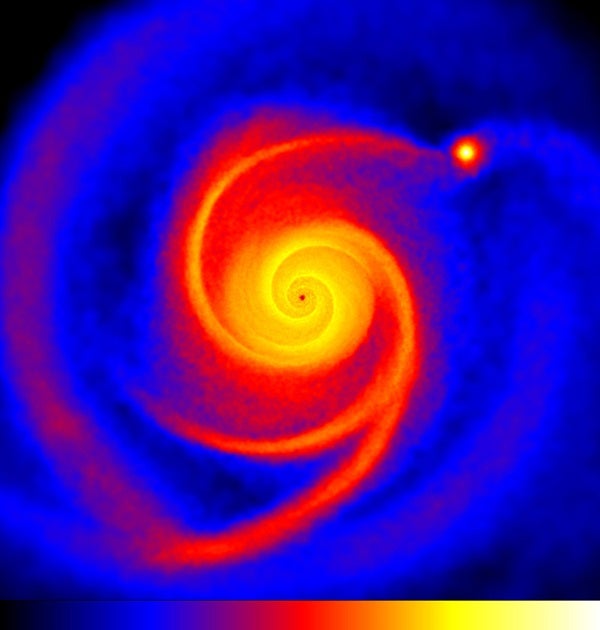
Team member Ken Rice of the University of Edinburgh ran a computer simulation to find out how such a massive protoplanet could form. His animation shows a very similar body condensing out of a disk with similar properties to that actually observed around HL Tau. The planet forms because of gravitational instability in the disk, which is about half as massive as the star itself. This allows small regions to separate out and cool down into self-contained structures. This instability mechanism has been controversial, but the simulated and real data are such a good match that it seems the mechanism really does operate in nature.

Rice comments, “The simulations were as realistic as we could make them and we were delighted that the results compare so well with the observations.”

One intriguing property is that XZ Tau, another young star in the same region, may have passed near HL Tau about 1,600 years ago. Although not required for planet formation, it is possible that this flyby tweaked the disk and helped it become unstable. This would be a very recent event in astronomical terms. Whether the proto-planet formed in only the last few hundred years, or sometime in the 100,000 years since the birth of HL Tau, the images provide a unique view of planet formation in action, and the first picture of a protoplanet still embedded in its birth material.

Source of solar wind

X-ray image of the Sun
A X-ray image of the Sun made with the Hinode satellite on
February 20, 2007. The insets show the flow of gas away from the bright region marked on the left. The blue image indicates material flowing towards us that will eventually make up the solar wind and the red image shows material flowing away from us back towards the surface of the Sun.
L. Harra/JAXA/NASA/ESA
April 2, 2008
An international team of scientists has found the source of the stream of particles that make up the solar wind. In a presentation on Wednesday April 2 at the RAS National Astronomy Meeting (NAM 2008) in Belfast, Professor Louise Harra of the UCL-Mullard Space Science Laboratory will explain how astronomers have used a UK-led instrument on the orbiting Hinode space observatory to finally track down the starting point for the wind.

The solar wind consists of electrically charged particles that flow out from the Sun in all directions. Even at their slowest, the particles race along at 200 kilometers per second, taking less than 10 days to travel from the Sun to the Earth. When stronger gusts of the wind run into the magnetic field of the Earth there can be dramatic consequences, from creating beautiful displays of the northern and southern lights to interfering with electronic systems on satellites and sometimes even overloading electrical power grids on the ground.

From its launch in the autumn of 2006, scientists have used the Hinode mission to study the Sun in unprecedented detail. One of the instruments on the probe, the UK-built Extreme Ultraviolet Imaging Spectrometer (EIS) measures the speed at which material flows out from the Sun.

The Sun is a cauldron of hot gas shaped by magnetic fields, which create bright regions of activity on the solar surface. Using EIS, the scientists found that at the edges of these bright regions hot gas spurts out at high speeds. Magnetic fields connect the regions together, even when they are widely separated. For example, in the Hinode images that Harra will present on Wednesday, magnetic fields linked two regions almost 500,000 kilometers apart &#8212 a distance equivalent to 40 Earths placed side by side in space. When magnetic fields from two regions collide they allow hot gas to escape from the Sun &#8212 this material flows out as the solar wind.

Harra says, “It is fantastic to finally be able to pinpoint the source of the solar wind &#8212 it has been debated for many years and now we have the final piece of the jigsaw. In the future we want to be able to work out how the wind is transported through the solar system.”

Old galaxies stick together

old galaxies
The white arrows point to a few of the old, massive galaxies at a distance of 10 billion light years, discovered in the UKIDSS Ultra-Deep survey. This cut-out image represents just 1/150th of the full survey.
UKIDSS UDS Survey Team
April 2, 2008
Using the most sensitive images ever obtained with the United Kingdom Infra-Red Telescope (UKIRT), astronomers have found convincing evidence that galaxies, which look old early in the history of the universe, reside in enormous clouds of invisible dark matter and will eventually evolve into the most massive galaxies that exist in the present day.

The distant galaxies identified in the UKIRT images are considered elderly because they are rich in old, red stars. However, because the light from these systems has taken up to 10 billion years to reach Earth, they are seen as they appeared in the very early universe, just 4 billion years after the Big Bang. The presence of such fully evolved galaxies so early in the life of the cosmos is hard to explain and has been a major puzzle to astronomers studying how galaxies form and evolve.

United Kingdom Infrared Telescope
The United Kingdom Infrared Telescope sits on Mauna Kea, Hawaii
JAC/UKIRT
University of Nottingham PhD student Will Hartley, who led the study, and collaborators used the deep UKIRT images to estimate the mass of the dark matter surrounding the old galaxies by measuring how strongly the galaxies cluster together. All galaxies are thought to form within massive halos of dark matter which collapse under their own gravity from a smooth distribution of matter after the Big Bang.

These halos are invisible to normal telescopes but their mass can be estimated through analysis of galaxy clustering.

Hartley explains, “Luckily, even if we don’t know what dark matter is, we can understand how gravity will affect it and make it clump together. We can see that the old, red galaxies clump together far more strongly than the young, blue galaxies, so we know that their invisible dark matter halos must be more massive.”

United Kingdom Infrared Telescope
The Wide Field Camera (long black tube) on the United Kingdom Infrared Telescope on Mauna Kea, Hawaii.
JAC/UKIRT
The halos surrounding the old galaxies in the early universe are found to be extremely massive, containing material up to one hundred thousand billion times the mass of our Sun. In the nearby universe, halos of this size are known to contain giant elliptical galaxies, the largest galaxies known.

“This provides a direct link to the present day universe,” says Hartley, “and tell us that these distant old galaxies must evolve into the most massive but more familiar elliptical-shaped galaxies we see around us today. Understanding how these enormous elliptical galaxies formed is one of the biggest open questions in modern astronomy and this is an important step in comprehending their history.”

Hartley spoke at the RAS National Astronomy Meeting in Belfast on Tuesday April 1.

The Moon’s stellar companion

The Moon and the Pleiades
Watch the Moon snuff out individual stars in the northern Pleiades April 8. This illustration depicts the scene just before the stellar occulations begin.
Astronomy: Jay Smith
April 2, 2008
The night sky will deliver one of its greatest spectacles April 8 when a crescent Moon will appear against the colorful tapestry of a twilit sky. Add the Pleiades star cluster to the mix and the stage is set for a performance no skygazer will want to miss.

Mark your calendar for Tuesday, April 8. Head outside no later than an hour or so after sunset (roughly 8:30 P.M. local daylight time), and look to the west. Your eyes should land immediately on the slender crescent Moon, oriented with its cusps standing nearly straight up from the horizon.

Binoculars will reveal a stunning sight. “Point them at the Moon,” says Astronomy Senior Editor Richard Talcott. “The bright Pleiades star cluster sparkles like a clutch of tiny diamonds accenting the primary jewel — the Moon.”

The Moon and the Pleiades
A crescent Moon met the Pleiades star cluster March 22, 2007. The two meet again after sunset April 8, although the Moon will be thinner crescent then.
Richard McCoy
The Pleiades ranks among the finest deep-sky objects in the sky. Also known as the Seven Sisters, the cluster contains more than 100 stars. Under a dark sky, keen observers typically can spot the six or seven brightest Pleiads. On the 8th, however, the nearby Moon likely will drive all the stars below naked-eye visibility. It takes about three Full Moons to span the Pleiades apparent size.

North Americans will get the best views of this conjunction. From the East Coast, the Moon stands just to the lower right of the cluster as darkness falls. The Moon appears closer to the cluster’s center the farther west you live.

From the West Coast, the Moon lies just above the cluster’s stars. Regardless of your location, the Moon will have moved noticeably relative to the cluster by the time the pair sets shortly after 11 P.M. local daylight time.

When you first gaze at the Moon, you may see only its brightly lit crescent. Look a little closer and you’ll see an ashen light filling out the “dark” part of the Moon’s disk. This light comes from sunlight reflecting off Earth’s dayside up to the Moon and back to us. Literally, the Moon is bathed in earthshine.

Gamma-ray burst detected

GRB 000131
The SIDNIT photos found a GRB like GRB 000131 imaged here. The image was taken with the ESO’s Very Large Telescope.
ESO
April 2, 2008
Light from an explosion more than half way across the universe has been detected by an internet amateur telescope that takes images for students and teachers free of charge.

The explosion, known as a gamma-ray burst, was photographed by the Seeing in the Dark Internet Telescope (SIDINT) in New Mexico on March 30. The SIDINT digital photos show the burst flaring up briefly and then fading from view within 4 hours.

Funded by the National Science Foundation, SIDINT is part of the public outreach effort associated with science writer Timothy Ferris’s documentary film Seeing in the Dark. The telescope has taken thousands of images for students and teachers who visit the show’s web site. The film, which premiered last year, is scheduled for rebroadcast on PBS at 8 P.M. Wednesday, June 11, 2008 (check local listings).

Astronomers studying the gamma-ray burst determined that its light traveled 8.4 billion light-years &#8212 more than half way across the radius of the observable universe &#8212 before reaching Earth. The light therefore was older than the Sun and Earth, which formed some 4.5 billion years ago.

“This detection of ancient light demonstrates that amateur astronomers with backyard telescopes can make real contributions to science, observing celestial events that were beyond the reach of even the largest professional telescopes within living memory,” says Ferris, whose film celebrates amateur astronomy. One of the stargazers appearing in the film, the rock musician Michael Koppelman, photographed an even more remote gamma-ray burst from his homemade observatory in rural Minnesota in 2006.

Gamma-ray bursts are the most energetic events in the known universe. Astronomers remain uncertain about just how they are created, but one mechanism may be the collapse of a giant star to form a black hole, resulting in a titanic explosion that can spit out intense jets of gamma rays, X-rays, and visible light.

When NASA’s orbiting SWIFT satellite detected the March 30 gamma-ray burst, it automatically emails the celestial coordinates to professional and amateur astronomers around the world. In Tucson, Arizona, SIDINT telescope manager Adam Block responded quickly to the news, activating the telescope over the internet and obtaining a sequence of images within minutes of the SWIFT alert. The resulting light curve data can be employed by astrophysicists to help understand how the bursts are produced. See a video of Block’s SIDINT images here.

The March 30 gamma-ray burst was also imaged by professional astronomers at observatories in France, Chile, Sweden, England, Arizona, Texas, and by the orbiting Japanese Hinode X-Ray Telescope. But the SIDINT images are the sole amateur contributions posted to date.

Viewers of the film Seeing in the Dark see SIDINT being installed by a team of four specialists in under 3 hours. The telescope consists entirely of commercially available, off-the-shelf components, but its computer-controlled mount and sensitive digital camera give it a range exceeding that of the famous Hale reflector at Palomar a half century ago, then the world’s largest telescope. Students using SIDINT are able to photograph galaxies more than 100 million light-years from Earth.

Astronomy magazine podcast: People and the Sky

Anthony Aveni
Thames and Hudson
April 2, 2008
Anthony Aveni, Russell Colgate Distinguished Professor of Astronomy and Anthropology and Native American Studies at Colgate University, is the author of numerous articles and books on the subject of archeoastronomy. His latest, People and the Sky, explores how ancient hunters, farmers, sailors, rulers, and storytellers were all once cosmically connected.

In this week’s show, Aveni talks about People and the Sky.

After you listen, e-mail us here and let us know what you think.

If you would like to subscribe to our podcast, click here.

Downloadable File(s)

Does the Moon wobble?

Full Moon mosaic
Yes. The direction of the Moon’s axis of rotation moves with respect to its north-south axis and with respect to the stars.

If you were on the Moon tracing out the direction of the axis of rotation on the surface near its north pole, you would see an elliptical path of about 0.8 by 1.3 miles (1.3 by 2.1 kilometers) plus much smaller variations. Each cycle of the large elliptical motion takes 6 years.

Other motions also describe the Moon’s three-dimensional orientation. The Moon rotates once every 27.3 days on average, but this rotation rate is not quite uniform. The lunar equator tilts 1.54° to the ecliptic plane and precesses with an 18.6-year period. But again, there are small additional variations in the lunar equator’s orientation. Collectively, these small, non-uniform parts of the rotation and equator orientation are called physical librations.

Because the Moon is not perfectly spherical, Earth’s gravitational pull on the Moon’s lumpy figure twists it. These pulls cause the physical libration variations. — James Williams, Stardust Science Team, NASA’s Jet Propulsion Laboratory, California Institute of Technology, Pasadena

Smallest black hole found

lowest-mass known black hole
The lowest-mass known black hole belongs to a binary system named XTE J1650-500. The black hole has about 3.8 times the mass of our Sun, and is orbited by a companion star, as depicted in this illustration.
NASA/CXC/A. Hobar
April 1, 2008
Using a new technique, two NASA scientists have identified the lightest known black hole. With a mass only about 3.8 times greater than our Sun and a diameter of only about 15 miles, the black hole lies very close to the minimum size predicted for black holes that originate from dying stars.

“This black hole is really pushing the limits. For many years astronomers have wanted to know the smallest possible size of a black hole, and this little guy is a big step toward answering that question,” says lead author Nikolai Shaposhnikov of NASA’s Goddard Space Flight Center.

The tiny black hole resides in a Milky Way Galaxy binary system known as XTE J1650-500, named for its sky coordinates in the southern constellation Ara. NASA’s Rossi X-ray Timing Explorer (RXTE) satellite discovered the system in 2001. Astronomers realized soon after J1650’s discovery that it harbors a normal star and a relatively lightweight black hole. But the black hole’s mass had never been measured to high precision.

Shaposhnikov and his Goddard colleague Lev Titarchuk presented their results on Monday, March 31, at the American Astronomical Society High-Energy Astrophysics Division meeting in Los Angeles.

black hole
In this top-down illustration of a black hole and its surrounding disk, gas spiraling toward the black hole piles up just outside it, creating a traffic jam. The traffic jam is closer in for smaller black holes, so X-rays are emitted on a shorter timescale.
NASA
The method used by Shaposhnikov and Titarchuk has been described in several papers in the Astrophysical Journal. It uses a relationship between black holes and the inner part of their surrounding disks, where gas spirals inward before making the fatal plunge. When the feeding frenzy reaches a moderate rate, hot gas piles up near the black hole and radiates a torrent of X-rays. The X-ray intensity varies in a pattern that repeats itself over a nearly regular interval. This signal is called a quasi-periodic oscillation, or QPO.

Astronomers have long suspected that a QPO’s frequency depends on the black hole’s mass. In 1998, Titarchuk realized that the congestion zone lies close in for small black holes, so the QPO clock ticks quickly. As black holes increase in mass, the congestion zone is pushed farther out, so the QPO clock ticks slower and slower. To measure the black hole masses, Shaposhnikov and Titarchuk use archival data from RXTE, which has made exquisitely precise measurements of QPO frequencies in at least 15 black holes.

Last year, Shaposhnikov and Titarchuk applied their QPO method to three black holes whose masses had been measured by other techniques. In their new paper, they extend their result to seven other black holes, three of which have well-determined masses. “In every case, our measurement agrees with the other methods,” says Titarchuk. “We know our technique works because it has passed every test with flying colors.”

Rossi X-ray Timing Explorer
The measurement of the black hole’s mass is due to high-precision timing observations made by NASA’s Rossi X-ray Timing Explorer satellite, shown here prior to launch.
NASA
When Shaposhnikov and Titarchuk applied their method to XTE J1650-500, they calculated a mass of 3.8 Suns, with a margin of uncertainty of only half a Sun. This value is well below the previous black hole record holder with a reliable mass measurement, GRO 1655-40, which tips the scales at about 6.3 Suns.

Below some unknown critical threshold, a dying star should produce a neutron star instead of a black hole. Astronomers think the boundary between black holes and neutron stars lies somewhere between 1.7 and 2.7 solar masses. Knowing this dividing line is important for fundamental physics, because it will tell scientists about the behavior of matter when it is scrunched into conditions of extraordinarily high density.

Despite the diminutive size of this new record holder, future space travelers had better beware. Smaller black holes like the one in J1650 exert stronger tidal forces than the much larger black holes found in the centers of galaxies, which make the little guys more dangerous to approach. “If you ventured too close to J1650’s black hole, its gravity would tidally stretch your body into a strand of spaghetti,” says Shaposhnikov.

Shaposhnikov adds that RXTE is the only instrument that can make the high-precision timing observations necessary for this line of research. “RXTE is absolutely crucial for these black hole mass measurements,” he says.

Stephen James O’Meara’s secret sky: How to find a Space needle in a haystack

In my last two columns, I explained how to observe the nebula Barnard’s Loop in Orion. This 10°-wide emission nebula, also known as Sharpless 2-276, may be the only supernova remnant visible to the unaided eye. This month, I’m taking you to the other extreme. I’d like observers, especially those in the southern United States and beyond, to seek out the tiny emission nebula NGC 2736 in Vela.

The Moon grazes the Pleiades

Shortly after sunset April 8, the waxing crescent Moon crosses the bright Pleiades star cluster. This spectacular evening occultation highlights a month featuring several worthy solar system targets. Both Mars and Saturn grace the evening sky. The Red Planet shines brightly in Gemini, while the ringed planet plies Leo and remains visible until shortly before dawn. In the early morning, nice views of Jupiter will be punctuated by fleeting streaks of light from the Lyrid meteor shower around April 22.

Two new star systems found

yellow supergiant eclipsing binary
This image shows a yellow supergiant eclipsing binary.
Kevin Gecsi/Ohio State University
April 1, 2008
Astronomers have spied a faraway star system that is so unusual it was one of a kind &#8212 until its discovery helped them pinpoint a second one that was much closer to home.

In a paper published in a recent issue of the Astrophysical Journal Letters, Ohio State University astronomers and their colleagues suggest that these star systems are the progenitors of a rare type of supernovae.

They discovered the first star system 13 million light-years away, tucked inside Holmberg IX, a small galaxy that is orbiting the larger galaxy M81. They studied it between January and October 2007 with the Large Binocular Telescope (LBT) on Mt. Graham in Arizona.

The star system is unusual, because it’s what the astronomers have called a yellow supergiant eclipsing binary &#8212 it contains two very bright, massive yellow stars that are very closely orbiting each other. In fact, the stars are so close together that a large amount of stellar material is shared between them, so that the shape of the system resembles a peanut.

Holmberg IX
The dwarf galaxy Holmberg IX, seen here to the upper left of M81, is the site of the newly discovered star system.
Ohio State University
In a repeating cycle, one star moves to the front and blocks our view of the other. From Earth, the star system brightens and dims, as we see light from two stars, then only one star.

The two stars in this system appear to be nearly identical, each 15 to 20 times the mass of our Sun.

José Prieto, Ohio State University graduate student and lead author on the paper, analyzed the new star system as part of his doctoral dissertation. In his research, he scoured the historical record to determine whether his group had indeed found the first such binary.

To his surprise, he uncovered another one a little less than 230,000 light-years away in the Small Magellanic Cloud, a small galaxy that orbits our own Milky Way.

The star system had been discovered in the 1980s, but was misidentified. When Prieto reexamined the data that astronomers had recorded at the time, he saw that the pattern of light was very similar to the one they had detected outside of M81. The stars were even the same size &#8212 15 to 20 times the mass of the Sun &#8212 and melded together in the same kind of peanut shape. The system was clearly a yellow supergiant eclipsing binary.

“We didn’t expect to find one of these things, much less two,” says Kris Stanek, associate professor of astronomy at Ohio State. “You never expect this sort of thing. But I think this shows how flexible you have to be in astrophysics. We needed the 8.4-meter LBT to spot the first binary, but the second one is so bright that you could see it with binoculars in your back yard. Yet, if we hadn’t found the first one, we may never have found the second one.”

dwarf galaxy Holmberg IX
Ohio State University astronomers and their colleagues took this image of the dwarf galaxy Holmberg IX with the LBT. The arrow indicates the approximate location of the newly discovered star system.
Ohio State University
“It shows that there are still valuable discoveries hidden in plain sight. You just have to keep your eyes open and connect the dots.”

The find may help solve another mystery. Of all the supernovae that have been studied over the years, two have been linked to yellow supergiants &#8212 and that’s two more than astronomers would expect.

Prieto explains why. Over millions of years, a star will burn hotter or cooler as it consumes different chemical elements in its core. The most massive stars swing back and forth between being cool red supergiants or hot blue ones. They spend most of their lives at one end of the temperature scale or the other, but spend only a short time in-between, where they are classified as yellow. Most stars end their life in a supernova at the red end of the cycle; a few do at the blue end. But none do it during the short yellow transitional phase in between.

At least, that’s what astronomers thought.

Prieto, Stanek, and their colleagues suspect that yellow binary systems like the ones they found could be the progenitors of these odd supernovae.

“When two stars orbit each other very closely, they share material, and the evolution of one affects the other,” Prieto says. “It’s possible two supergiants in such a system would evolve more slowly, and spend more time in the yellow phase &#8212 long enough that one of them could explode as a yellow supergiant.”

The discovery of this yellow supergiant binary system is just the first result of a long-term LBT project to monitor stellar variability in the nearby universe. That project is led by Ohio State professor of astronomy Chris Kochanek. He and Rick Pogge, also a professor of astronomy, are coauthors on the paper in Astrophysical Journal Letters.