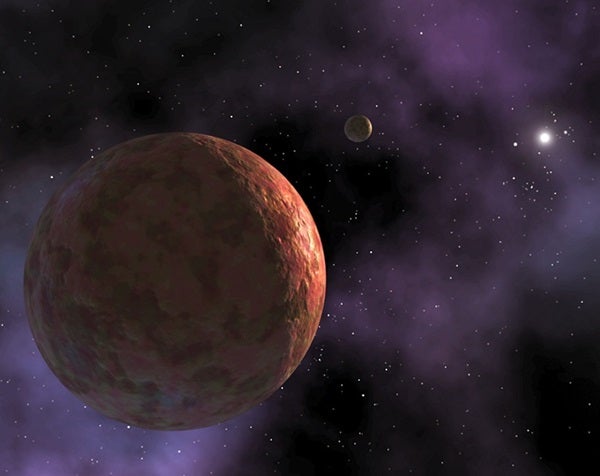
On March 15, 2004, astronomers Mike Brown of Caltech, Chad Trujillo of Gemini Observatory, and David Rabinowitz of Yale University announced the discovery of the coldest, most distant object known to orbit the Sun. The team again returned its attention to Sedna in early September 2004, just as the frigid worldlet was becoming available to the Keck telescopes in Hawaii a few hours before night’s end.
| Sedna’s updated orbit | |
| Period: | 11,500 years |
| Closest to Sun: | 76 AU |
| Farthest from Sun: | 943 AU |
| Semimajor axis: | 509 AU |
| Inclination: | 11.93° |
| These values differ somewhat from those originally announced. Mike Brown notes that Sedna’s aphelion and semimajor axis are known to within about 10 percent and may still change slightly with additional observations. He says the most significant change to Sedna’s orbital parameters came when prediscovery images of the object were included in the computation. | |
One Sedna mystery Brown would like to solve soon is “that whole, crazy, 40-day rotation thing.” Back in March, he announced a possible rotation period of 40 days, and his team speculated Sedna rotated so slowly because it had a moon. Available data are consistent with a rotation of both 20 and 40 days. “We won’t know the real answer until a few 20- or 40-day periods have passed,” Brown says. “It’s very difficult to get data spanning that length of time,” he says, because his project has to compete with others for telescope time.
Asteroids typically rotate in a range from a few hours to a few days. While astronomers are less sure about the full range of rotation in Kuiper Belt objects, these bodies also seem to spin in less than a few days’ time. With a 20- or 40-day spin, Brown argues, Sedna is practically at a standstill. While it’s possible the last impact to occur on Sedna struck in just the right way to nearly cancel its asteroid-like spin, the odds of such a perfect hit are extremely low.
How big is Sedna? “We have upper limits now from the [Hubble] Space Telescope, which didn’t resolve the disk, and from the Spitzer telescope, which didn’t detect Sedna’s thermal emission,” Brown says. “Both of those limits are consistent with a size of about three-quarters that of Pluto.” Another argument also puts Sedna in the same size range. If Sedna reflected all the sunlight falling on it, calculations show, it would be about 1,120 miles (1,800 kilometers) across. Yet nothing in the outer solar system reflects more than 20 percent of incident light, which brings the size down to 75 percent that of Pluto, or a little over 1,000 miles (1,610 km). Brown and his colleagues are trying to obtain new observations to constrain the size still further.
Brown’s group has initiated new programs fine-tuned to locate objects moving through the sky at a Sedna-like pace. “Almost all of the searches for Kuiper Belt objects that are currently taking place stop at about 100 AU. And the reason is that, as things get farther and farther away, their motions in the sky are slower and slower,” he notes. An object moving slower than a couple of arcseconds an hour will evade detection. So, the team’s new programs look exclusively for such slow-moving objects, like Sedna. “We are quite excited to see if we can find things that are moving much more slowly than that.”
Finding such a population, he argues, is where the biggest scientific payoff is going to be. Objects like Sedna appear to be in a special place in the solar system, held to the Sun more strongly than the distant comets of the Oort Cloud but more loosely than the planets. Simulations show that placing Sedna in its orbit without disrupting the comet cloud requires unusual circumstances, such as the close passage of a Sun-like star early in the solar system’s history.
“When we find, you know, tens or dozens of objects like Sedna on orbits like Sedna’s, we will be able to quite definitively read this fossil record and tell you almost exactly what happened 4.5 billion years ago,” he says. “You just don’t get those opportunities very frequently.”
To hear Brown speak of it, Sedna and its companions are a fossil record of circumstances at the solar system’s birth. But this scenario won’t hold if a distant, unknown planet affects Sedna and its relatives the way Neptune scatters Kuiper Belt objects. Still, Brown thinks such an object is increasingly unlikely.
“If you had asked me 2, 3 years ago, I would have said, ‘Not only is that high on the list, but I’m going to bet that’s the most likely thing.’ But we’ve spent the last 3 years diligently searching the outer solar system, and we’ve covered a lot of territory,” Brown explains. “Nothing like that has shown up yet. There’s always room to hide things, but the hiding places are getting smaller and smaller.”
What’s the most personally satisfying aspect of discovering Sedna? Says Brown: “The high points are the letters from the kids. There’s no comparison. … I have a pile of mail I’m still going through from school kids.”
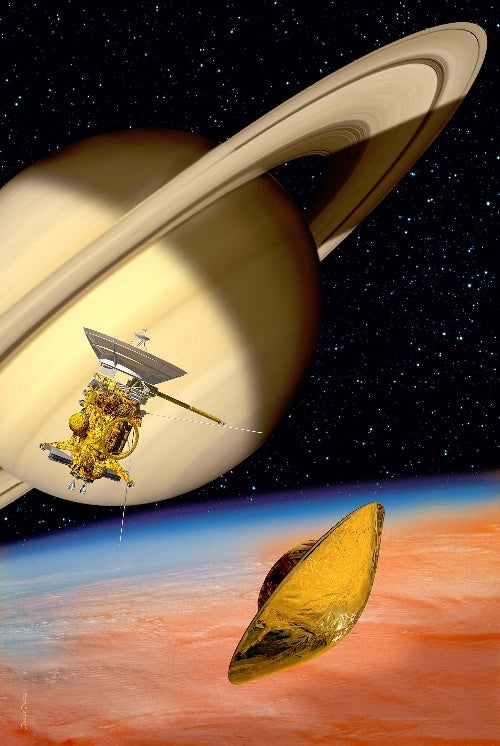
The Cassini-Huygens mission to Saturn has already revolutionized our understanding of Saturn and its rings and moons, but what we’ve seen so far is nothing, says Dennis Matson, project scientist for the mission.
“What you’re seeing in press releases is just a skimming of some of the cream. We’re so busy operating the spacecraft, and getting the data down, and creating a plan of what to do next, the teams don’t have enough time or work force to get all the cream out of the data, let alone all the discoveries,” he says.
Matson believes one reason for Cassini’s success was the mission’s rigorous testing program. “We had the philosophy that, whenever you’re doing anything this complicated, you’ve got to … find every single error that was made,” Matson recalls. That philosophy continues today in spacecraft operations. “When we went into orbit around Saturn, there was nothing new that we were doing — every command, every piece of software, everything that was done had been exercised in some way prior to orbit insertion,” he says.
Conservative design is one reason Cassini has fared so well during its 7-year voyage to Saturn. All key spacecraft systems have backups — even the engine. “It took weight and mass, but it was felt that, cruising for so long, all the key systems on the spacecraft had better be redundant. So we have a completely redundant control system for the spacecraft, all the way from the central computer … through to the main engine,” Matson says. So far, Cassini has used only one of its 2 engines, and it has “performed spectacularly.”
| Cassini in the news |
| James Oberg tells the full story of the Huygens tests in this feature at IEEE Spectrum Online.
An icy dome and lava flow on Titan |
Yet, due to budget and scheduling constraints, there was no pre-launch end-to-end test of communications between the Cassini spacecraft and Huygens, the European Space Agency’s probe that will drop into the atmosphere of Saturn’s haze-shrouded moon Titan. In February 2000, controllers finally ran the test, using NASA’s Deep Space Network tracking antenna in Goldstone, California, to simulate a data stream from Huygens. But what Cassini sent back wasn’t what they expected. Matson calls that discovery “a real white-knuckle thing.” Had the problem gone unnoticed, he says, “We would have received only about 20 percent or less of the data from Huygens.”
Fixing the problem required changing Cassini’s approach to minimize the line-of-sight speed — and thus the Doppler shift — between the two spacecraft. So, instead of arriving on Titan November 2004 as originally planned, Huygens will be deployed December 24 and encounter Titan January 14, 2005.
This has all been tested on the ground with additional simulations from Goldstone to the spacecraft. “We get the right answer now,” Matson says.
In anticipation of planetary shadow play, the European Southern Observatory (ESO) set up a comprehensive web site to support observers around the world. One goal of the Venus transit observing campaign was to re-enact the historical determination of Earth’s distance to the Sun — a measure known as the Astronomical Unit, or AU. More than 1,500 observers watched Venus creep onto the Sun, timing when its silhouetted limb contacted the Sun’s edge, contributing some 4,500 timings.
Software on the web site collected the observations and made a first pass at the calculation, but the error associated with this computation was surprisingly large. On November 2, 2004, ESO released the results of a more extensive data analysis, done in cooperation with the Institut de Mécanique Céleste et de Calcul des Éphémérides (IMCCE) in Paris. The final result:
| calculated value of 1 AU, with uncertainty | difference from true value |
| 149,608,708 ± 11,835 km | 10,838 km |
| 92,966,851 ± 7,354 miles | 6,734 miles |
Here’s another way to think about this calculation. Radar observations tell us that 1 AU equals 149,597,871 km. Using this value as a known quantity, astronomers can compute the radii of Venus and the Sun from the transit timing observations. The results:
| object | calculated radius, with uncertainty | difference from true value |
| Sun | 695,980.7 km ± 806 km | 8.6 km |
| 432,482.4 miles ± 500 miles | 5.3 miles | |
| Venus | 6,052.3 ± 7.0 km | 0.5 km |
| 3,760.9 ± 4.3 miles | 0.3 mile |
Despite a Europe-heavy distribution of observing sites, and relative inexperience among reporting observers, ESO says the results are more accurate than any of the transit-based calculations of past centuries.
According to IMCCE astronomers Patrick Rocher and Jean-Eudes Arlot, who wrote explanatory notes detailing their computations, many factors helped make the project so successful. Telescope optics, transit timings — in many cases assisted by digital image recording and image-processing software — and knowledge of each observer’s location on Earth were much improved over historical transit observations.
In fact, says ESO, if astronomers had not known the distance to the Sun before the 2004 Venus transit, they would have been able to measure it with an accuracy of 0.007 percent through this project alone. For more on the project, including notes on the calculations, see the VT-2004 web site.
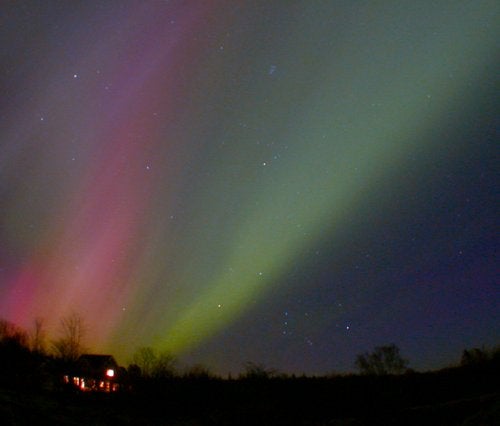
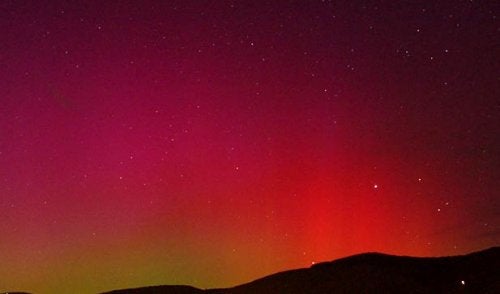
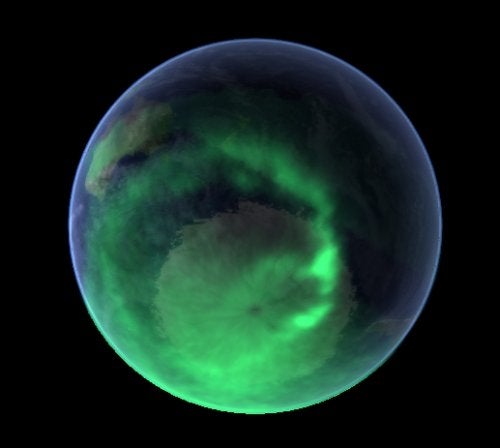
Solar flares, coronal mass ejections (CMEs), and brilliant auroral displays made headlines again in November 2004. While solar activity then was nowhere near as intense as it was in the fall of 2003, it proved to be another reminder that, even on the downswing, the Sun can spawn storms that take even experts by surprise.
Major episodes occurred August and October 1972 — 3.8 years after solar cycle 20 peaked in November 1968. The August event included the fastest CME on record, which traveled from the Sun to Earth in just 17 hours. Cycle 21, which peaked December 1979, followed suit, with X10- and X13-level flares December 1982 and April 1984, respectively.
The Halloween Storms of October-November 2003 rank as one of the largest outbreaks of solar activity in recent history. The Sun fired off 17 major flares between October 19 and November 5, including the most intense ever recorded by spaceborne instruments. The November 4 flare produced a barrage of X rays that quickly overwhelmed the detector on the NOAA GOES 12 satellite, saturating the instrument for 13 minutes. Although the flare’s X-ray peak could not be measured directly, scientists at the SEC later extrapolated what data they had and pegged the flare at X28 on the center’s intensity scale.
But the Big One could have been much bigger. In the March 17, 2004, issue of Geophysical Research Letters, Neil Thomson, Craig Rodger, and Richard Dowden of the University of Otago in Dunedin, New Zealand, estimated the flare’s peak based on how Earth’s ionosphere responded to the flood of radiation.
The CMEs that struck Earth during the Halloween Storms were among the fastest ever directly measured near Earth. A team led by R. M. Skoug of Los Alamos National Laboratory discussed these extremely fast solar winds in the September 15, 2004, issue of the Journal of Geophysical Research. Near Earth, the solar wind typically moves at around 895,000 mph (1.4 million km/h), but the CMEs that swept past NASA’s early-warning ACE spacecraft October 29 and 30 were moving at more than 3.8 million mph (6.1 million km/h) — fast enough to close the Sun-Earth distance in about 19 hours.
Yet as fast as these events were, they could have packed a bigger punch. If the interplanetary magnetic field had pointed south for a longer time, or if the CME clouds themselves had more typical densities, the storms would have had greater impact on satellites, space probes, and terrestrial power grids.
For more on the Halloween Storms, the solar activity that spawned them, and their aftermath, read the SEC’s official report: