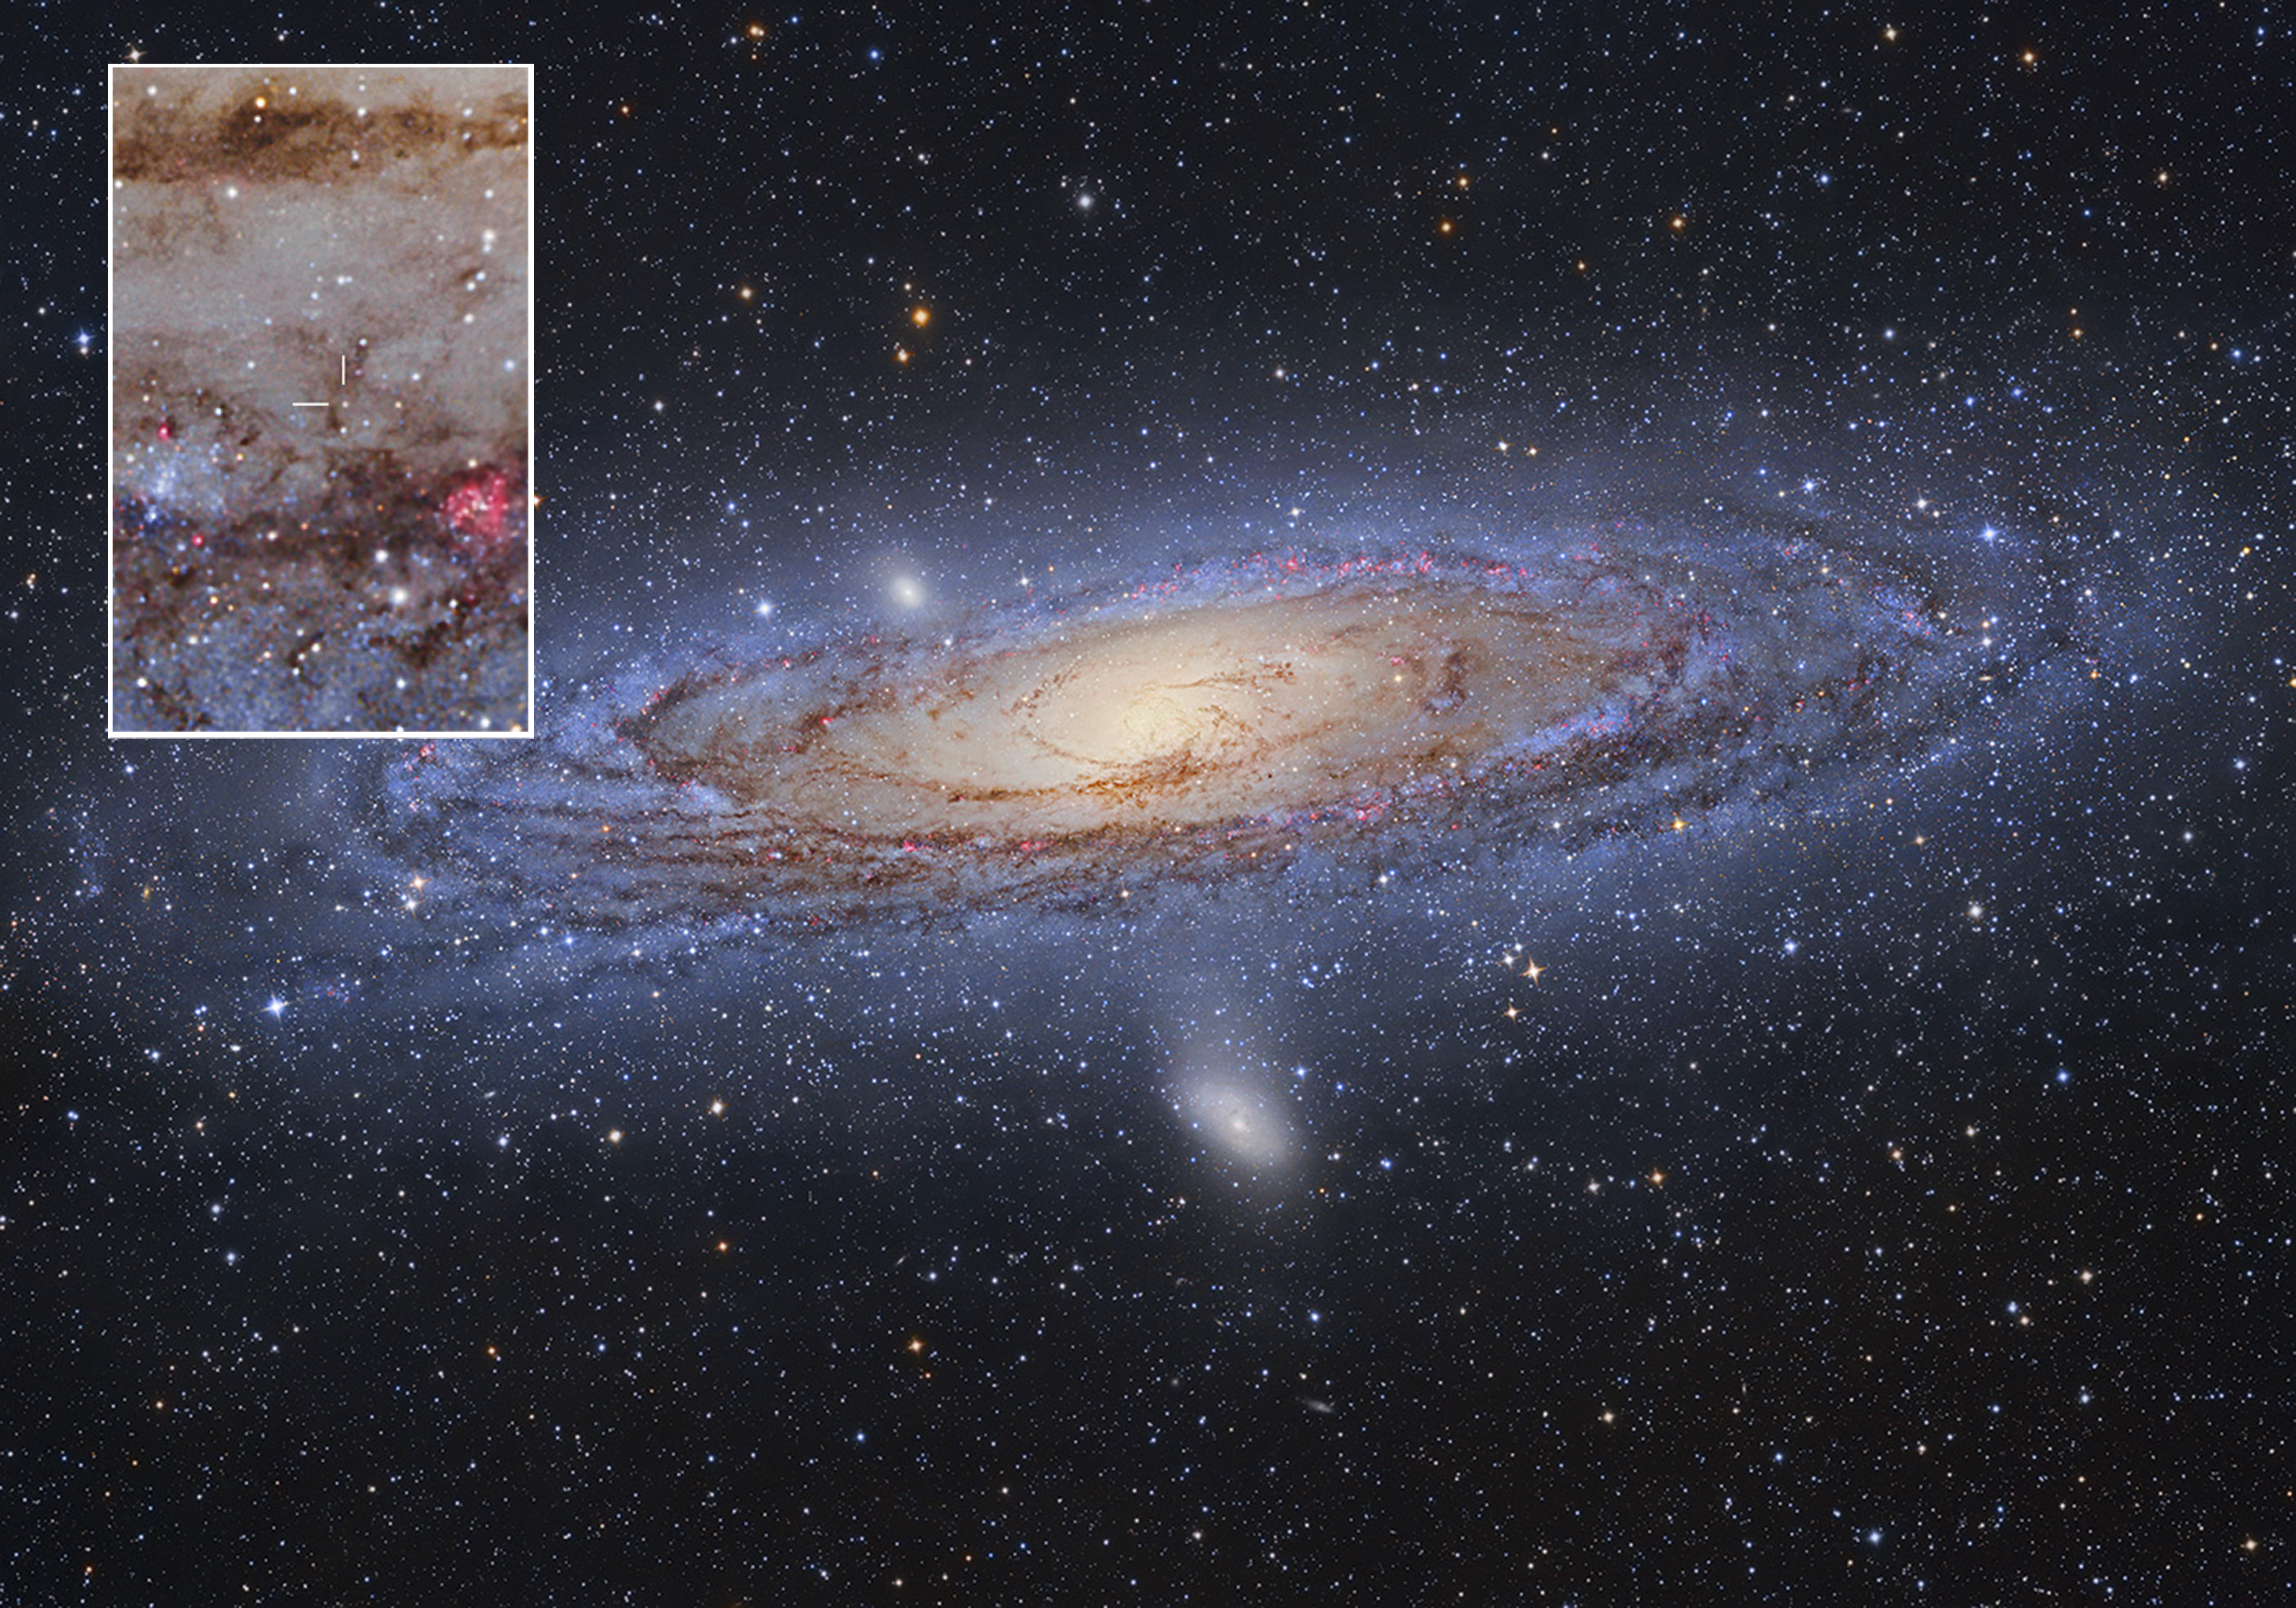
You know that M31 (NGC 224) in Andromeda is another galaxy far outside our own Milky Way, don’t you? Of course you do! Everyone knows that.
But we haven’t always known it. In fact, we’ve only known for just under a century. Prior to that, astronomers referred to M31 and scores of other galaxies scattered throughout the sky as spiral nebulae. They were visible in great numbers in a bewildering variety of sizes, shapes, and orientations. But no one knew their distance. And their true nature was a hotly debated issue.
On April 26, 1920, astronomers Harlow Shapley of Mount Wilson Observatory and Heber Curtis of Lick Observatory held a Great Debate at the Smithsonian Institution in Washington, D.C. The topic: the nature of spiral nebulae and the scale of the universe. Shapley had measured the size of the Milky Way in 1915 and found it far larger than most astronomers had imagined. He argued the Milky Way was the entire universe and the spiral nebulae were smaller objects within it. Perhaps they were swirling stellar nurseries or condensing solar systems. Curtis argued they were galaxies, each like the Milky Way, and therefore extremely large and at vast distances. The debate had no clear winner.
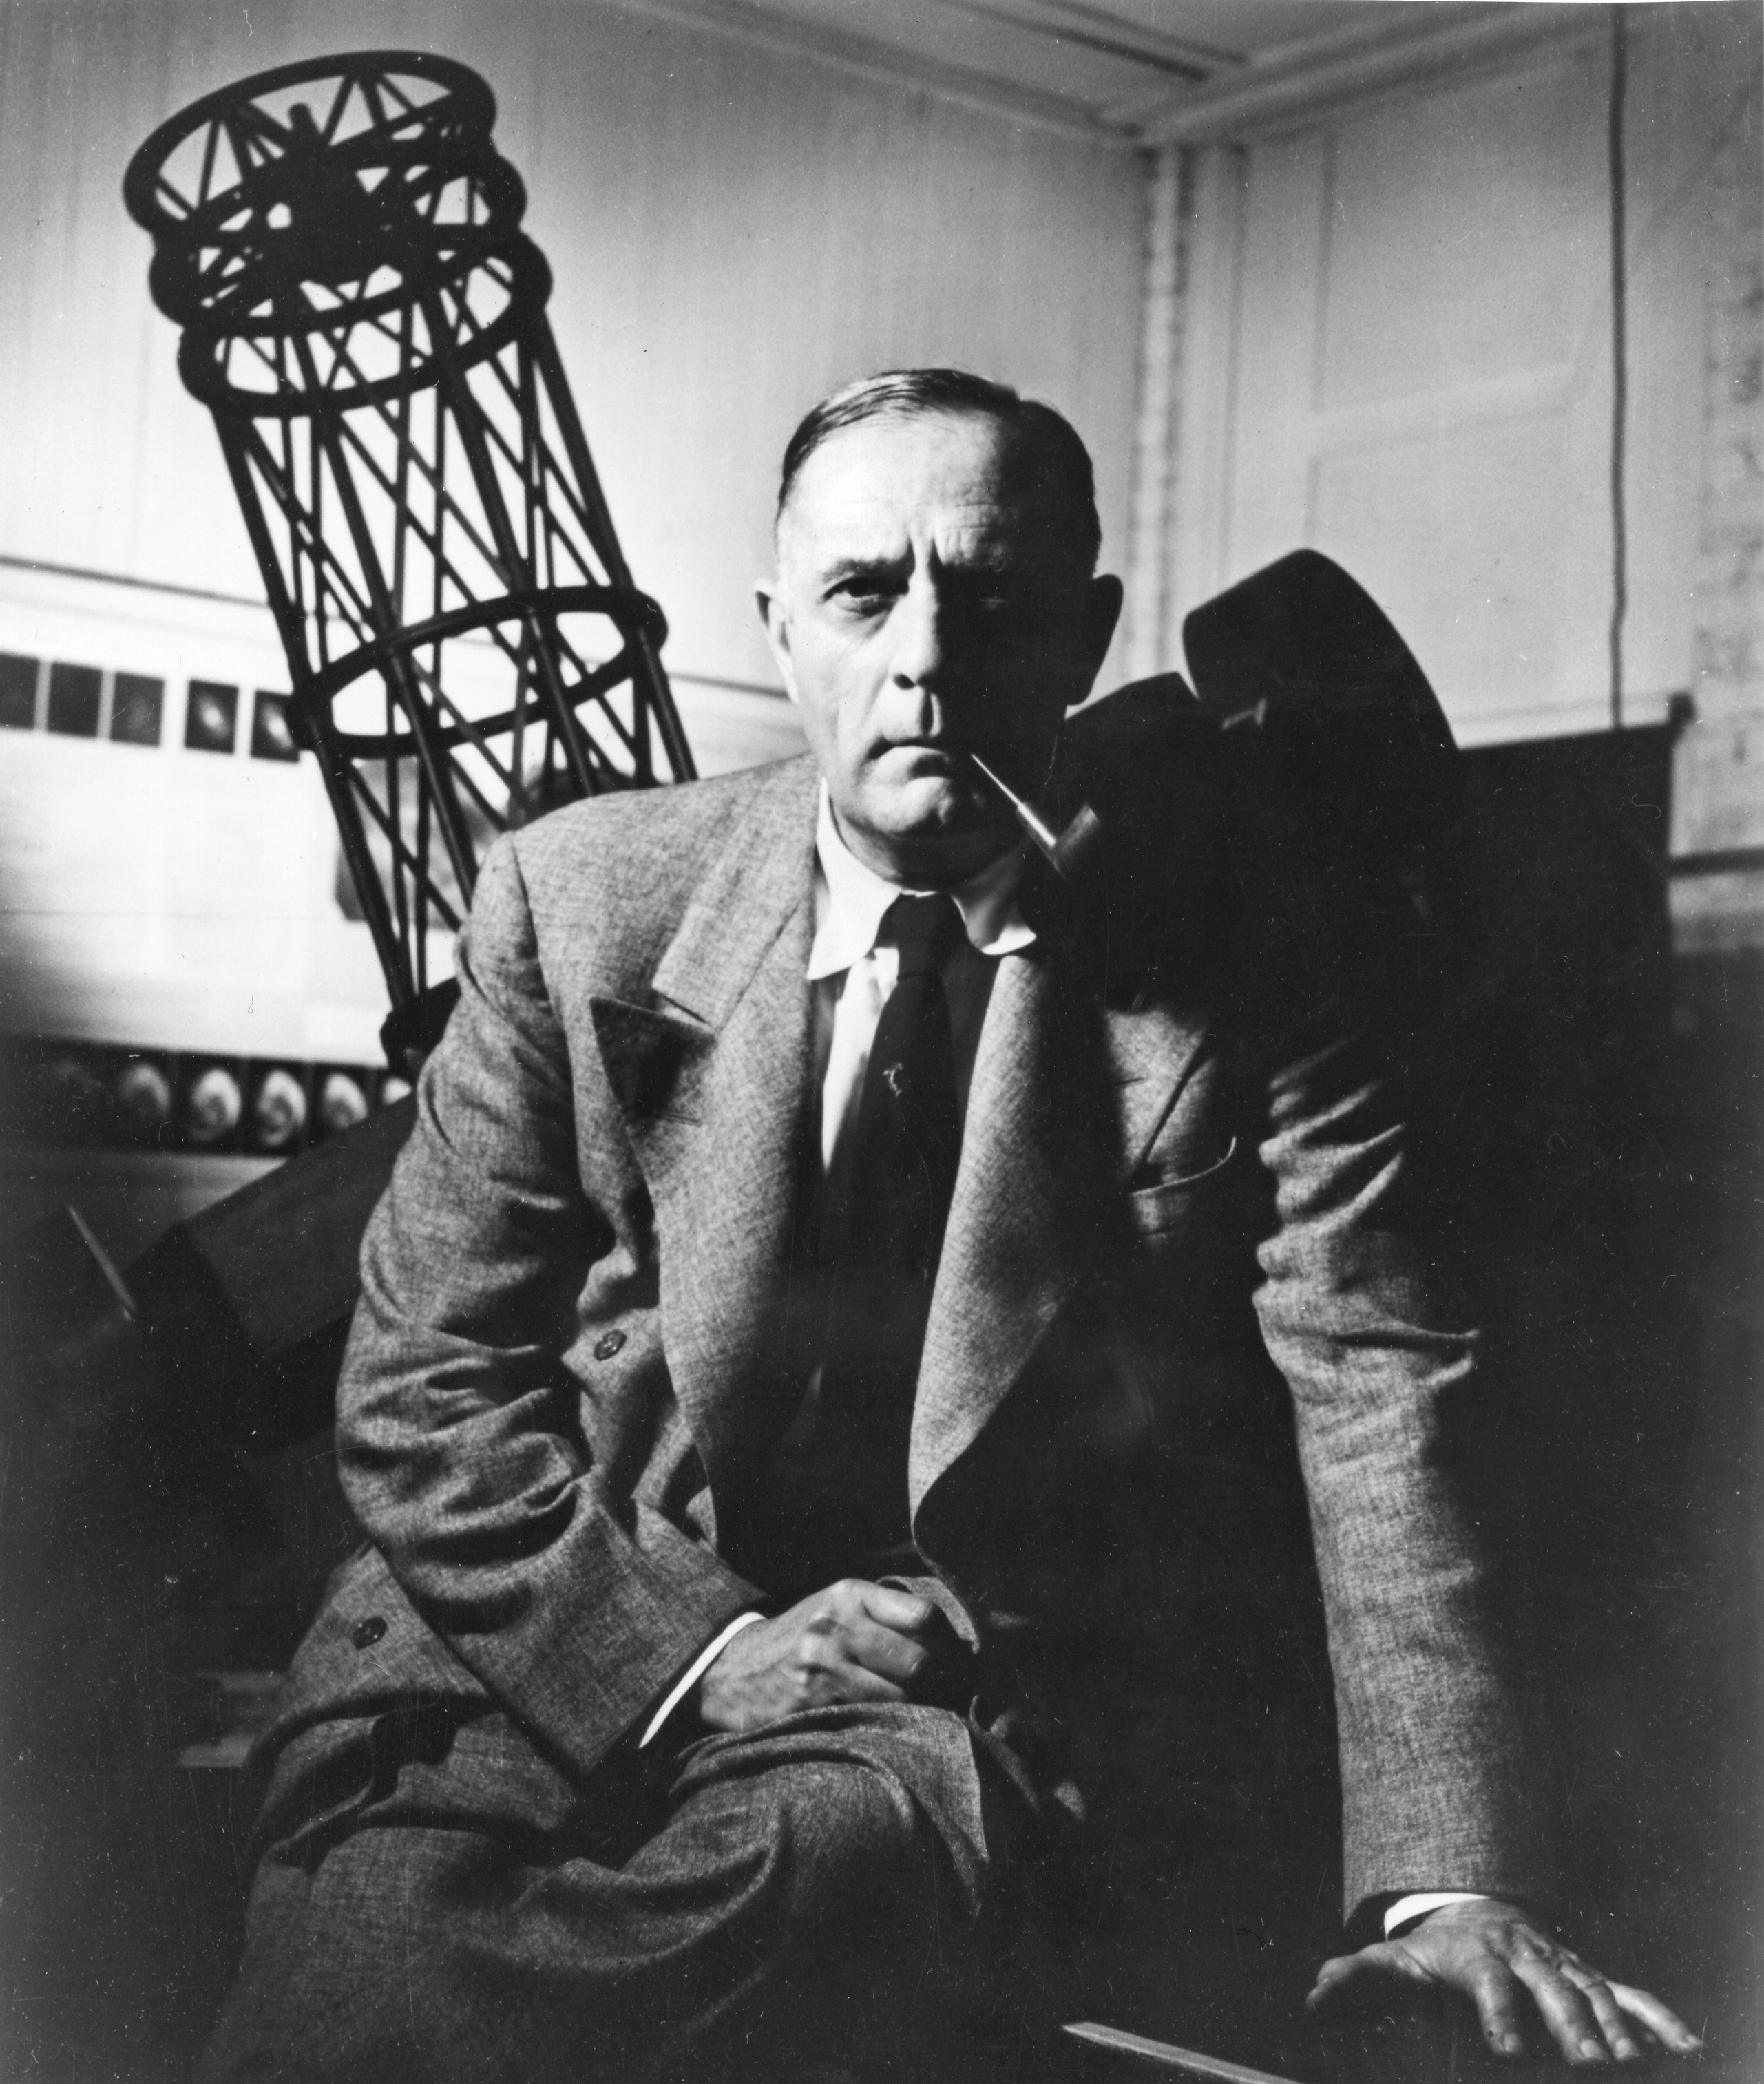
Just a few years later, in 1923, Edwin Hubble settled it. Using the 100-inch Hooker Telescope and photographic glass plates at Mount Wilson Observatory, he discovered a variable star within M31. Hubble used that star to show M31 lies far outside the Milky Way, proving it had to be another galaxy. The universe suddenly got much bigger. In fact, if the myriad spiral nebulae that appeared smaller than M31 were also galaxies in their own right, they must be farther still. The universe had to be unbelievably enormous.
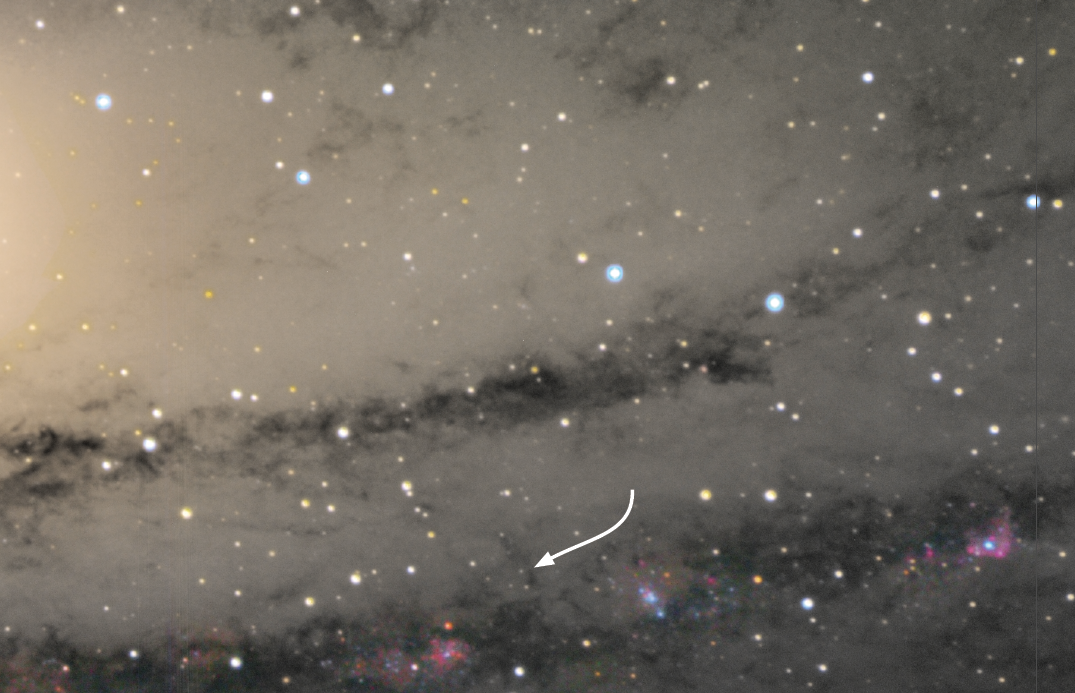
Hubble’s star, the first variable found in M31, has since been dubbed M31-V1. It is the star that changed the cosmos.
Emulating Hubble
As an avid astrophotographer, I wanted to take my own image of this star. But could I? I don’t have a 100-inch telescope. I have a 14-inch telescope, which is magnitudes smaller. On the other hand, I do have a cooled CCD camera, which is much more sensitive to light than the photographic glass plates Hubble used. Could my smaller telescope with a more responsive detector possibly match a larger scope with less sensitive plates when looking at this faint target?
With some research, I found that 11 members of the American Association of Variable Star Observers (AAVSO) had successfully imaged M31-V1 in 2010 at the request of the Space Telescope Science Institute. Researchers wanted to know when the star was brightest to best image it with the Hubble Space Telescope (HST) for a public outreach program. The AAVSO report indicated they found M31-V1 a challenging but achievable target for modern CCD cameras and “larger” telescopes. How large was not reported. Still, their success convinced me I could at least attempt to image M31-V1 for myself.
Then a bigger question hit me. While imaging M31-V1, could I also use my images to prove M31 is another galaxy? That would be a fantastic project. After all, we are approaching the centennial of Hubble’s discovery of M31-V1. What better time to emulate his work? To do that, I would not only need to duplicate Hubble’s astrophotography; I would also need to understand how he used his images of M31-V1 to prove M31’s distance.
A standard candle
Hubble determined the distance to M31 by finding a so-called standard candle within it. A standard candle is an object of known luminosity, or intrinsic brightness. If you know an object’s luminosity, you can compare that to how bright it appears from your vantage point and work out how far away it must be. The standard candle Hubble found in M31, the star M31-V1, is a Cepheid variable star.
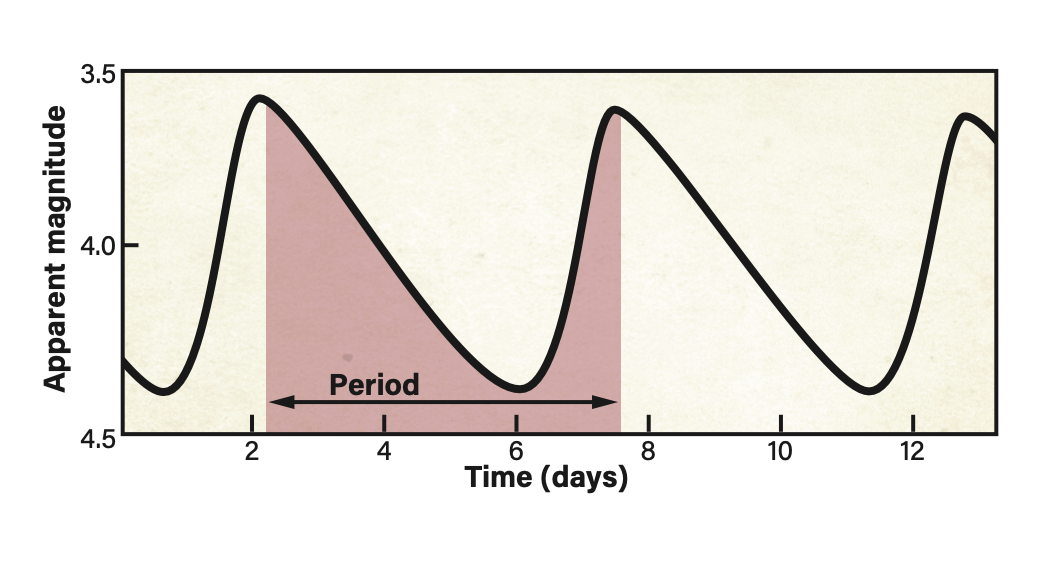
Cepheids are pulsating stars whose brightness varies over timescales ranging from one to more than 120 days. They exhibit a distinctive pattern on a graph of brightness versus time, called a light curve, consisting of a sharp increase in brightness followed by a gradual dimming. This pattern repeats at regular intervals, known as the period.
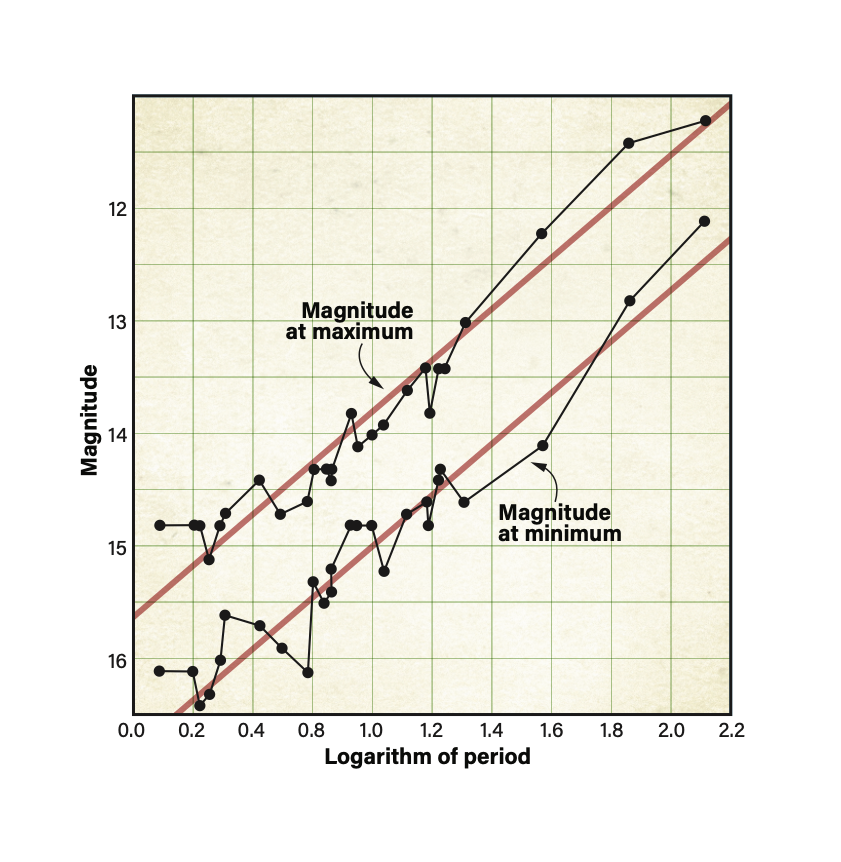
While working for the Harvard College Observatory, Henrietta Swan Leavitt discovered a relationship between a Cepheid’s period and true luminosity. She noted that the longer a Cepheid variable’s period, the brighter it appeared. In 1912, she published a graph showing a strong positive linear correlation between the logarithm of these stars’ periods and average apparent magnitudes. This is now known as the period-luminosity relationship, or the Leavitt law.
Danish astronomer Ejnar Hertzsprung realized the tremendous significance of Leavitt’s discovery. Once calibrated, this relationship would allow astronomers to calculate the distance to any Cepheid from two pieces of data: its period and its average apparent magnitude. But Hertzsprung’s early attempts at calibration were crude at best, yielding a distance to the Small Magellanic Cloud of 30,000 light-years, compared to the currently accepted value of 200,000.
Shapley revised the calibration but his work was also incorrect, leading him to estimate our galaxy’s diameter was 300,000 light-years instead of the currently accepted 100,000. His measurements did correctly show we were at the outskirts of the Milky Way, rather than its center — the biggest demotion of our place in the universe since Copernicus put the Sun at the center of the solar system.
However, a much bigger demotion was to come.
How Hubble did it
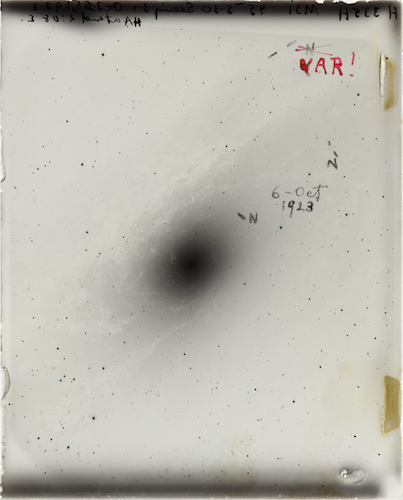
In September 1923, Hubble began taking serial exposures of M31 from Mount Wilson. On the night of Oct. 5/6, he made a 45-minute exposure on plate H335H. (The first H stands for Hooker, the last for Hubble.) Upon examination, he marked three stars in black with the letter N for novae, because they appeared to be new compared to earlier plates. However, he subsequently noticed that one of those three was present on earlier plates, including H331H taken the previous night. In fact, it appeared on archival plates as far back as 1909, but fluctuated in brightness. So, it couldn’t be a nova and must be a variable star.
With a red pen, Hubble crossed out the letter N and wrote “VAR!” for variable. Why the exclamation point? Hubble realized that if this star was a Cepheid, he had struck astronomical gold. If he could determine the Cepheid’s period and its average apparent magnitude, then he could calculate the distance to M31 and solve the mystery of the spiral nebulae.
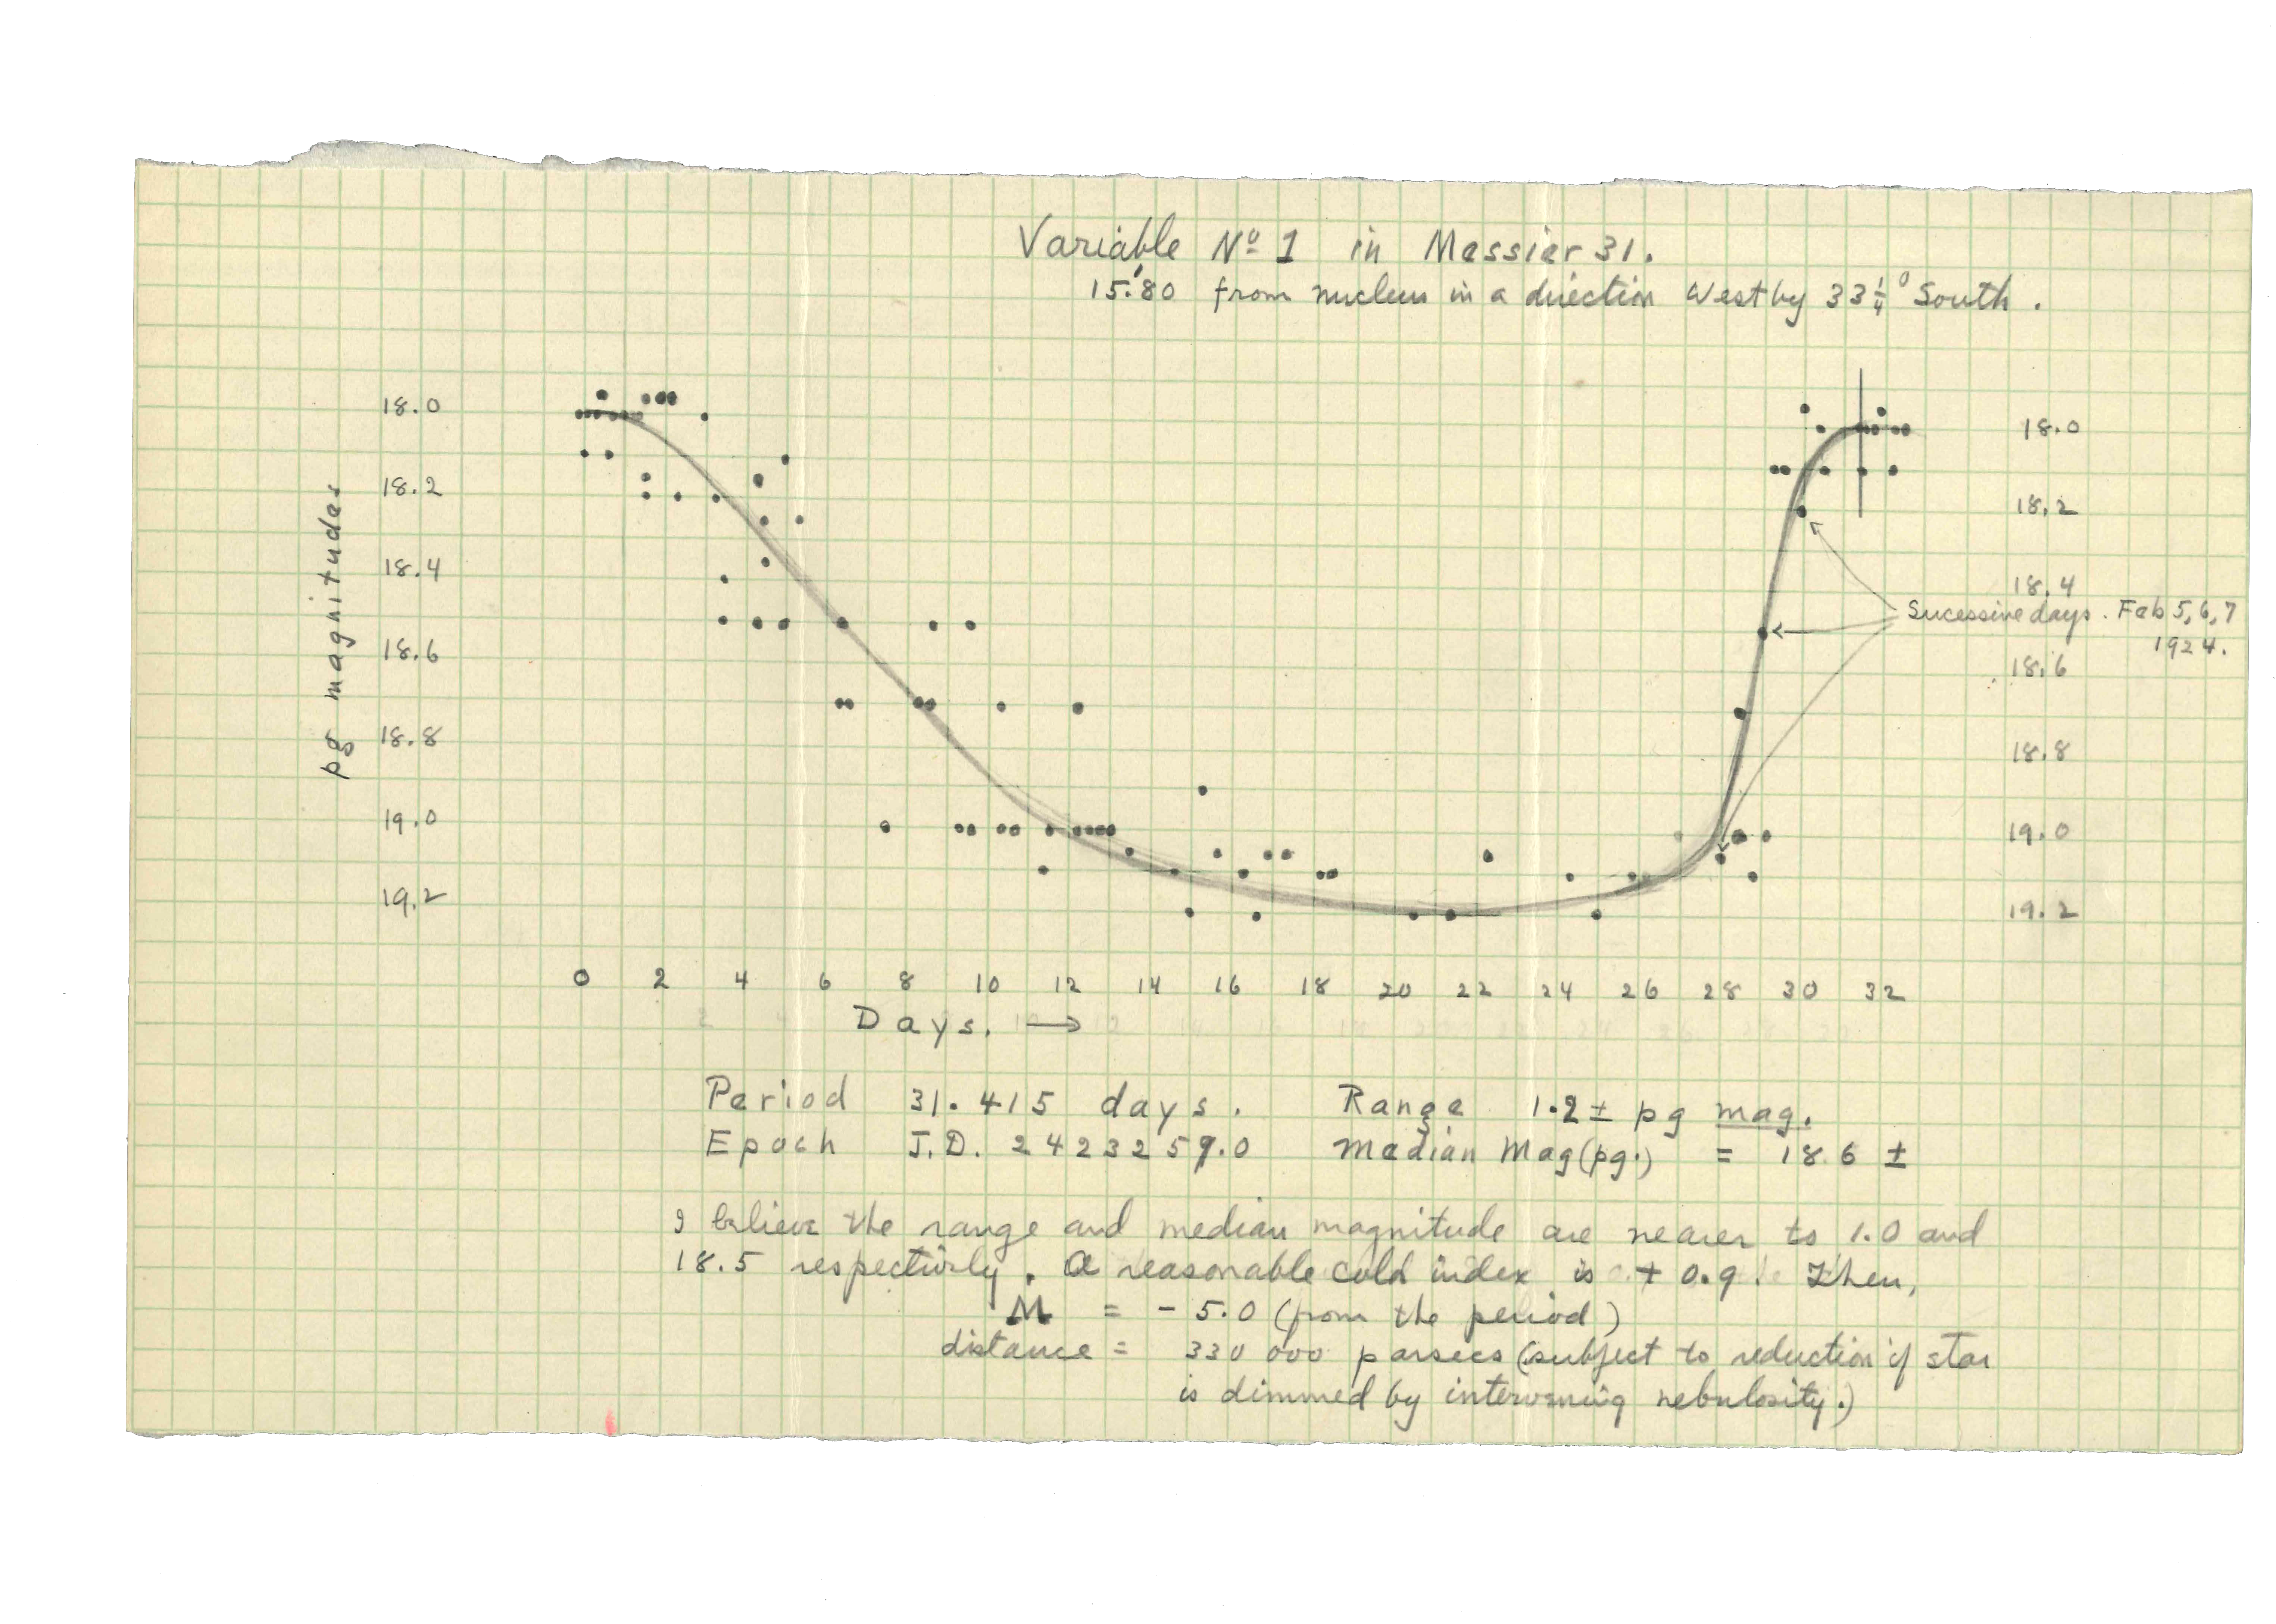
In early 1924, Hubble imaged this star on as many successive nights as weather permitted and determined its nightly magnitude. His data produced the characteristic light curve of a Cepheid. He measured its period as 31.415 days and estimated its median apparent magnitude at 18.5. From the period, Hubble derived an absolute magnitude of –5.0. He then calculated that for a Cepheid this bright to exhibit an apparent magnitude of 18.5, it had to be nearly 1 million light-years away. Therefore, M31 could only be an enormous independent galaxy outside the Milky Way.
In 1929, Hubble published an estimated distance to M31 of 900,000 light-years, calculated using additional observations and Shapley’s revised calibration of the period-luminosity relationship. The currently accepted distance to M31 is 2,537,000 light-years. The same errors that caused Shapley to overestimate the diameter of the Milky Way caused Hubble to underestimate the distance to M31.
Planning the project
To reproduce Hubble’s work, I needed to produce a light curve to determine both M31-V1’s period and average apparent magnitude. Measuring magnitudes of stars on digital images is now done with photometry software, which determines the magnitude of a target star by comparing its brightness to that of a comparison star of known magnitude on the same image. My imaging software, MaxIm DL Pro, includes a tool to do this.
The AAVSO website’s Star Plotter, which allows users to create star charts at various scales and orientations to match their images, includes comparison stars and their magnitudes. Fortunately for me, the AAVSO established many comparison stars within 15′ of M31-V1 in preparation for their 2010 project
Research indicated that to obtain the most accurate magnitude measurements, I should bin my images to 1×1. Further, my telescope is a Schmidt-Cassegrain, which is subject to mirror flop — a shift in mirror position with actions such as focusing or parking the telescope. Mirror flop can significantly change the illumination of a CCD chip between imaging sessions, affecting magnitude readings. Therefore, I committed to shooting new flat field calibration frames each night.
I imaged through a clear filter to capture as many photons as possible and used an f/7.5 focal reducer/corrector to reduce exposure time. M31 spans the width of six Full Moons across the sky, so only a portion of it would fit within my scope’s field of view. Therefore, my first tasks were to determine M31-V1’s location within M31 and how best to frame it on my CCD chip.
M31-V1 is at R.A. 00h41m27.3s, Dec. 41°10’10.4″, in the northeast quadrant of M31. Using imaging-planning software, I determined turning my CCD camera to a rotation angle of 135° and aiming at R.A. 00h41.1m, Dec. 41°11′ placed M31-V1 near the center of my chip. This orientation would also include the magnitude 9.27 foreground Milky Way star SAO 36590 as a suitable guide star in my off-axis guider, allowing for accurate tracking during imaging sessions. Several AAVSO comparison stars were present on my images.
Hubble didn’t know how many nights he would have to image M3-V1 to determine its period, but with the benefit of his work, I knew it would require at least a month and likely longer. A Cepheid’s period is most reliably measured between dates of maximum brightness. I didn’t know where M31-V1 would be in its cycle during my first observation. Therefore, I’d likely have to continue imaging until it peaked in brightness and carried out another full cycle until it peaked again. That meant I’d have to image some nights with a nearly Full Moon, which unfortunately would be in the vicinity of M31 during upcoming months. Bright moonlight flooding down my telescope tube might completely wash out M31-V1, especially if the Full phase coincided with the dim portion of the star’s cycle.
Then, there was weather. Hubble worked in sunny southern California, where he had only a few cloudy nights. I live in rainy Portland, Oregon, where even clear nights are often interrupted by clouds rolling in. There was also a risk of heavy smoke obscuring the sky for long periods during the upcoming wildfire season. This would indeed be a challenge.
Imaging the star
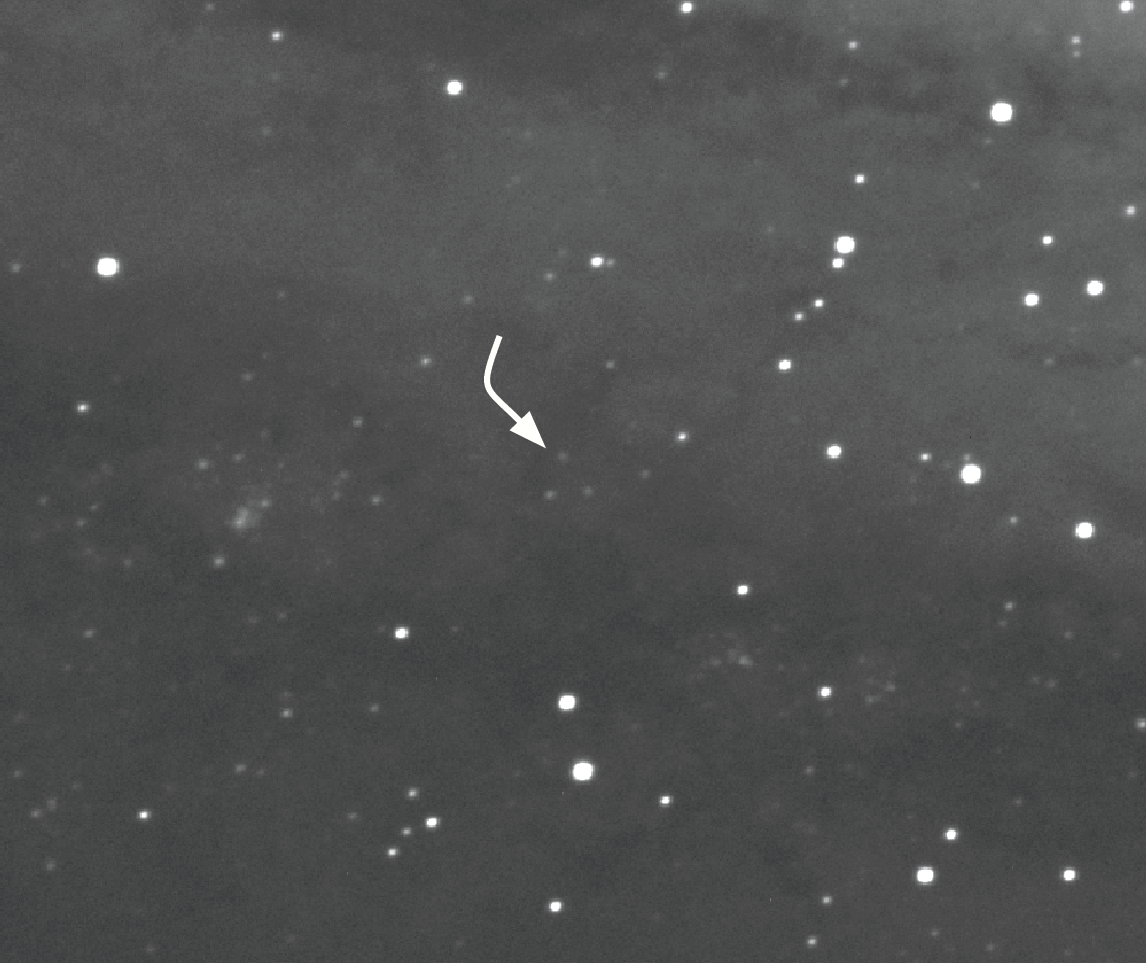
I began imaging in early August, a time when M31 rises above 45° altitude by 1 A.M. I calibrated and stacked the first night’s sub-exposures into a single integrated image. Then I zoomed in on the region containing Hubble’s Cepheid for inspection. M31-V1 appeared as a small, faint dot right where it was supposed to be! I stopped and stared at that star for a long time. During my 35 years as an astrophotographer, I have captured and inspected countless stars in my shots. This star was as inconspicuous and seemingly insignificant as any I had ever seen. Yet no other star I have imaged has been more important to cosmology and our understanding of our place in the universe than this small, dim one. Seeing the star that changed the universe on an image I had made myself took my breath away.
Spurred on by my initial success, I eagerly returned to my backyard observatory every clear night. I couldn’t wait to see if and when M31-V1 changed in brightness. As the Moon waxed toward Full, the star grew dim and I was concerned it might soon disappear from my images. My fears were allayed as it suddenly brightened, quickly reaching a peak. I continued imaging for weeks afterward, as it slowly faded again. As the Moon once again approached Full, the star quickly brightened, reaching a second peak. I observed every clear night for another couple of weeks as it faded for a third time. At that point, having imaged over a period of 57 nights, I knew I had collected data for more than one full period.
With my imaging completed, I calibrated and stacked all the sub-exposures from each night into an integrated image for that date. I was ready to make my own light curve of M31-V1.
Making light curves
I calibrated my photometry software on a comparison star near the center of each image. This worked extremely well — my magnitude readings on all other comparison stars read accurately to within a few hundredths of a magnitude. That gave me confidence my recorded magnitudes for M31-V1 were also accurate. Although my software displays magnitude readings to three decimal places, I could only justify reading M31-V1’s brightness to the nearest 0.1 magnitude because the magnitudes of comparison stars in my chart were given only to one decimal place.
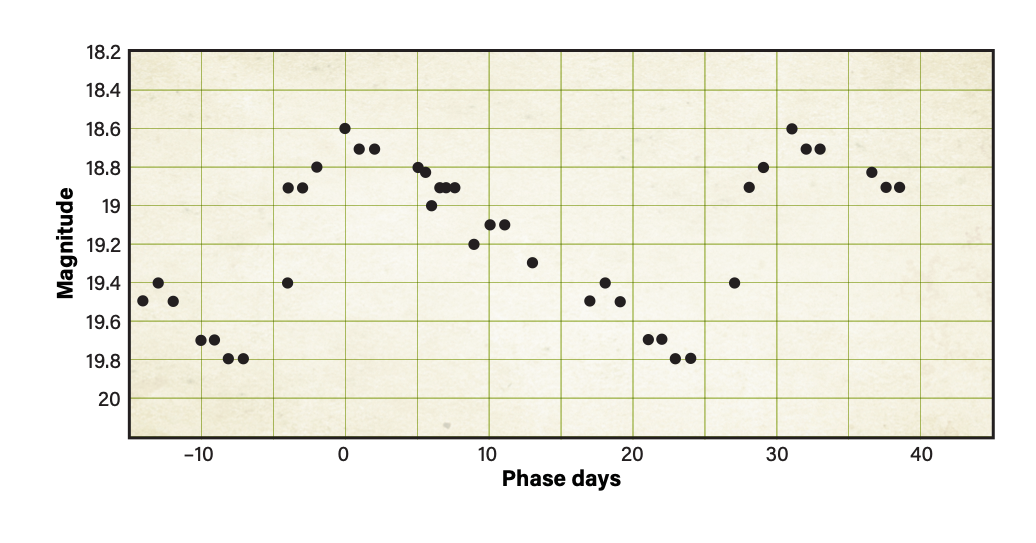
After measuring M31-V1’s magnitude on all my images, I plotted these by date on a graph. The resulting light curve definitely exhibited the characteristic pattern of a Cepheid. I could now derive the period and apparent magnitude to calculate the distance to M31.
The apparent magnitudes for the first and second maxima were 18.6 and both minima were 19.8. Therefore, the amplitude of my light curve was 1.2 magnitudes and the average apparent magnitude was 19.2. The difference in Julian dates for the maxima yielded a period of 31.91 days. Although this is not the period of 31.415 days derived by Hubble, the small difference had no appreciable impact on my calculated absolute magnitude. This is because the period-luminosity relationship uses the logarithm of the period to obtain absolute magnitude. The logarithms of 31.91 and 31.415 both round to 1.5.
The distance to M31
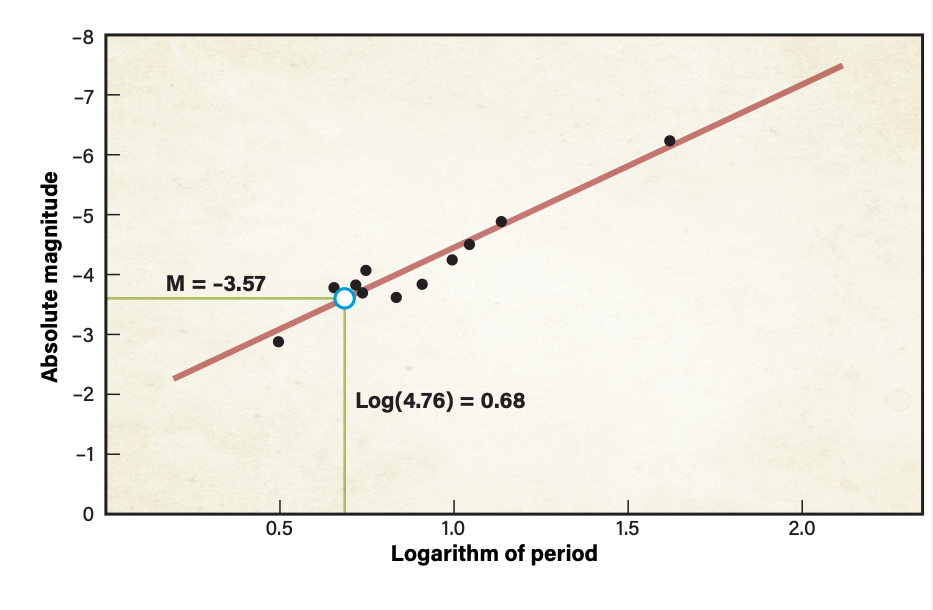
To compare my results for the distance to M31 directly to Hubble’s, I needed to use Shapley’s flawed calibration of the period-luminosity relationship. Curiously, Hubble adjusted this graph to yield absolute magnitude at maximum, rather than the average absolute magnitude as originally suggested by Leavitt and used in virtually all other calibrations. Hubble indicated he believed his maximum magnitude readings were more reliable than those obtained during dimmer portions of the cycle. Based on this graph, the logarithm of my 31.91-day period yielded an absolute magnitude for M31-V1’s maximum of –3.6.
Once you have an object’s absolute magnitude and corresponding apparent magnitude, it is simple to calculate its distance using an equation called the distance modulus: m – M = 5[log10(d/10)], where m is the apparent magnitude, M is the absolute magnitude, and d is the distance in parsecs. (One parsec is equal to 3.26 light-years.) Solving this equation for d gives d = 10(m-M+5)/5.
My values for m and M yielded a distance of 275,423 parsecs, or 897,879 light-years — very close to Hubble’s published value of 900,000. With this, I had accomplished my goal. Despite the flawed calibration, I had also proven M31 is so far away it must be a separate galaxy.
I was extremely pleased that my result was so close to Hubble’s. The difference was only 2,121 light-years. Then, while reading Hubble’s 1929 publication again, I noticed something remarkable. Although Hubble did not show his values for maximum apparent and absolute magnitude, he gave their difference: m – M = 22.2. That was precisely the value I had obtained! That could only mean Hubble had obtained exactly the same distance: 897,879 light-years. He simply rounded to 900,000 light-years in his paper. Now I was thrilled. I had done in my backyard what Hubble did at Mount Wilson, with precisely the same result.
Still, that result is incorrect because it is based on an incorrect calibration of the period-luminosity relationship. Since 1929, as technology has improved, the calibration has been revised. This has greatly increased the calculated distance to M31. With the advent of HST, that number is now 2.537 million light-years.
A memorable endeavor
With that, I declared the project a great success. Following in Hubble’s footsteps was an exhilarating experience I will certainly remember for the rest of my life. Most of all, I am amazed that I, a mere amateur astronomer using equipment in my backyard, was able to reproduce a feat that less than a century ago was accomplished by the world’s greatest astronomer using the world’s largest telescope.
This is a testament to amateur astronomy as a hobby. Want to be an amateur archaeologist or paleontologist? Good luck accessing an Egyptian tomb or a T. rex fossil bed to conduct your own research projects. Such valuable materials are reserved exclusively for professionals.
Not so with amateur astronomy. All astronomers have unrestricted access to the same crucial resource: the entire sky above us. And with that, the sky is truly the limit of what we amateurs can do.
Up to date
One of HST’s chief goals was to precisely determine distances to 10 Milky Way Cepheids by measuring their trigonometric stellar parallaxes — which can only be done from space — to produce a calibration of unprecedented accuracy for the period-luminosity relationship.
The equation for the period-luminosity relationship using the HST calibration is: M = (–2.43 + 0.12)[log10(P)-1.0] – (4.05 + 0.02), where M is absolute magnitude and P is the period.
Using my data with the HST calibration, how close could I come to the currently accepted distance of M31? My period of 31.91 days yields an absolute magnitude of –5.27 using this calibration. Then the distance modulus gives a distance of 776,247 parsecs or 2.531 million light-years. — R.P.