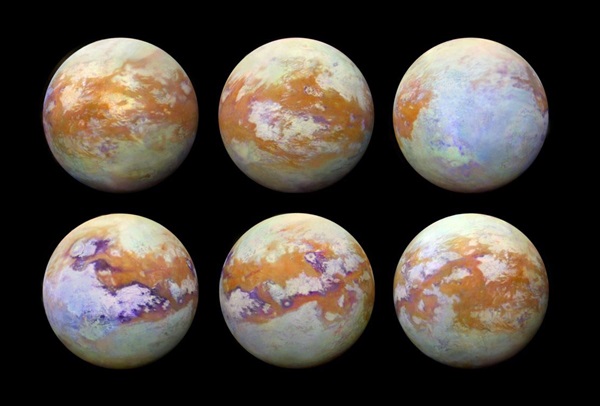
Researchers have spotted surprisingly diverse landscapes on Titan, from broad planes to sandy dunes and even rivers and lakes. But since the world is so cold, these features are made up of liquid methane and other organic compounds that slosh over a bedrock of solid, rock-hard ice. It’s tough to get great observations of the surface, though, because the moon’s atmosphere is a dense haze.
But even though the clouds make it tough to get good data, a paper this week in Nature Astronomy shows how useful a new analysis technique can be in mapping Titan and understanding its subtle surface features. And, almost as a bonus, it also spotted an entirely unexpected feature: a ribbon of exposed bedrock ice that wraps nearly halfway around the moon.

Easy PCA
The new technique is called principal components analysis (PCA), and it could be a game-changer for Titan-ophiles. Instead of examining individual pixels from Cassini photos and scouring them for details and data, PCA looks at all the pixels in a given area to spot trends in the landscape. This not only results in more refined data, but also turns out to be much less time-consuming than the leading alternatives, which do have to go one pixel at a time.
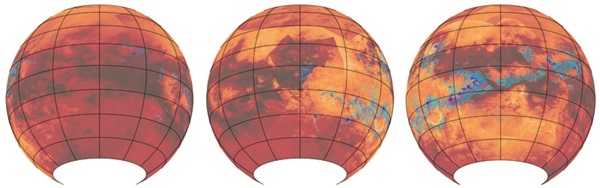
To test their new tool, and try to answer questions about why some patches of bedrock ice are exposed in the first place, the international team of researchers applied PCA to half of Titan’s surface, from 30° S to 30° N. They targeted the tropics in part because there was already relatively good data from this area, including firsthand from the Huygens lander. That made it easy to check their results.
Once everything was correlated and indeed found to be accurate, the team was left with a hi-def distribution of water ice on Titan. And curiously, the authors write, it formed in a noticeable pattern. “Our PCA study indicates that water ice is unevenly, but not randomly, exposed across Titan’s tropical surface. Most of the exposed ice-rich material follows a long, nearly linear, corridor that stretches 6,300 (kilometers),” or nearly 4,000 miles (6,400 km). That’s about 40 percent of Titan’s entire circumference. And, for reference, the United States stretches less than 3,000 miles (4,800 km) from coast to coast.
Titan Exposed
The team says it’s possible that the icy corridor formed sometime in the past billion years when Titan was still geologically active. And they specifically wonder if it’s tied to a “major cryovolcanic event” — a kind icy volcanism — that astronomers have speculated was happening during that time. But to really answer this question, along with the rest of Titan’s mysteries, the authors say additional studies are necessary.
Now that PCA has been shown to work well for this kind of task, a new era of discovery, and answers, may be in store for Saturn’s largest moon.