Key Takeaways:
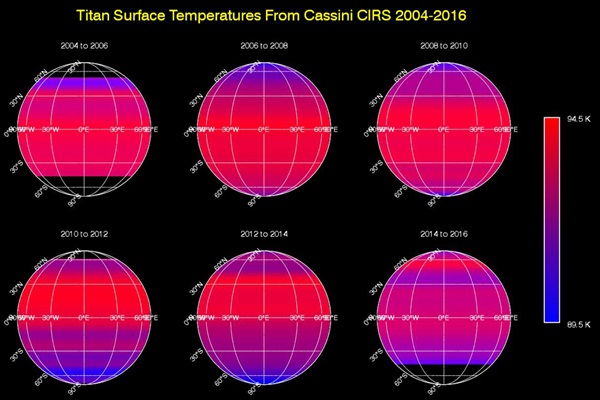
Titan’s surface temperature changes slowly over the course of the Saturn system’s long seasons, which each last seven and a half years. As on Earth, the amount of sunlight received at each latitude varies as the sun’s illumination moves northward or southward over the course of the 30-year-long Saturnian year.
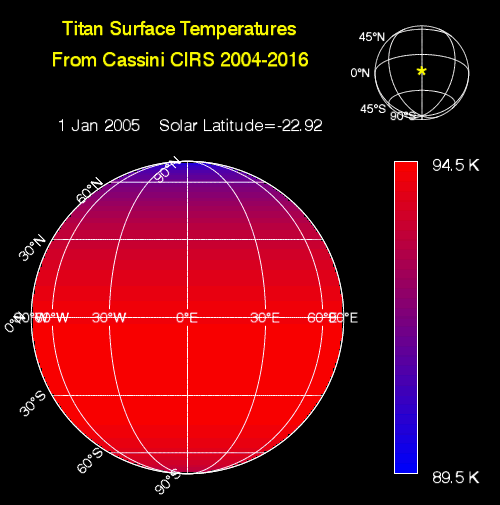
When Cassini arrived at Saturn in 2004, Titan’s southern hemisphere was in late summer and was therefore the warmest region. Shortly after the 2009 equinox, in 2010, temperatures were symmetrical across the northern and southern hemispheres, mimicking the distribution observed by Voyager 1 in 1980 (one Titan year earlier). Temperatures subsequently cooled in the south and rose in the north, as southern winter approached.
While the overall trend in the temperature shift is clearly evident in these maps, there is narrow banding in several places that is an artifact of making the observations through Titan’s atmosphere. The moon’s dense, hazy envelope adds noise to the difficult measurement.
Although it moves in latitude, the maximum measured temperature on Titan remains around -292 degrees Fahrenheit (-179.6 degrees Celsius, 93.6 kelvins), with a minimum temperature at the winter pole only 6 degrees Fahrenheit (3.5 degrees Celsius or kelvins) colder. This is a much smaller contrast than exists between Earth’s warmest and coldest temperatures, which can vary by more than 200 degrees Fahrenheit, or more than 100 degrees Celsius.