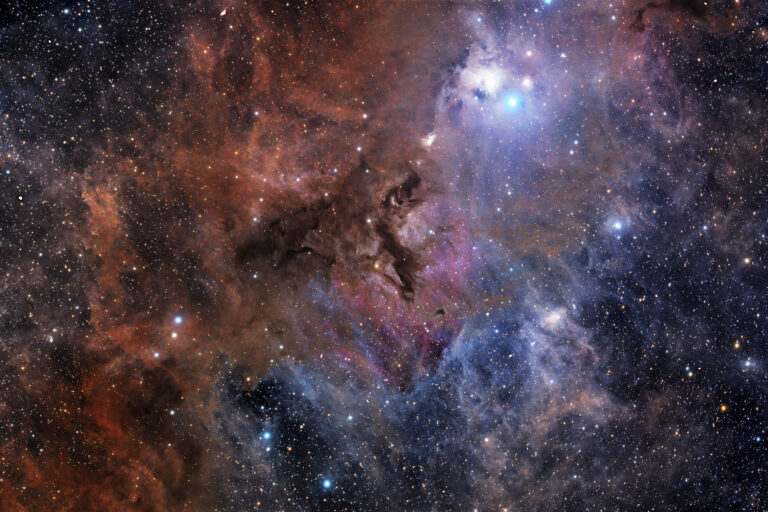
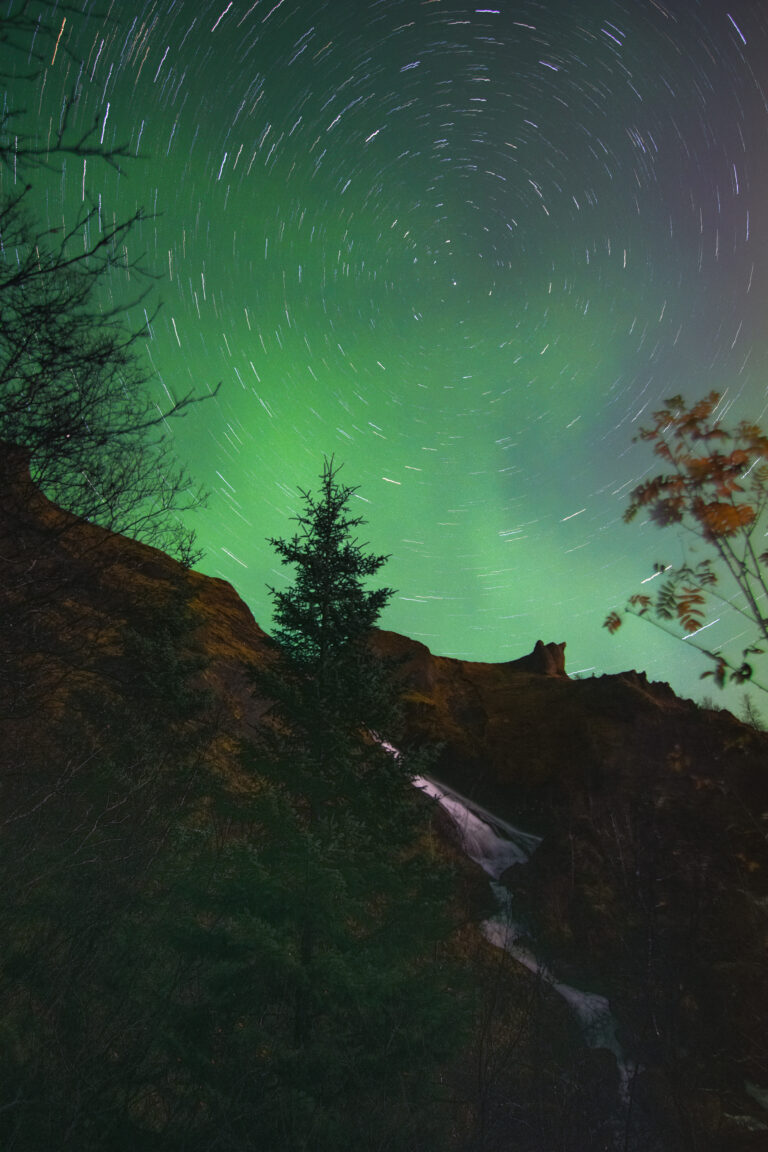
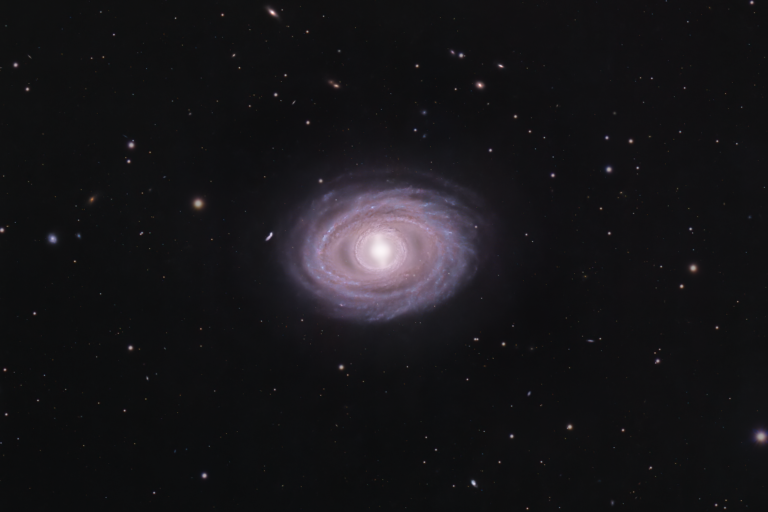
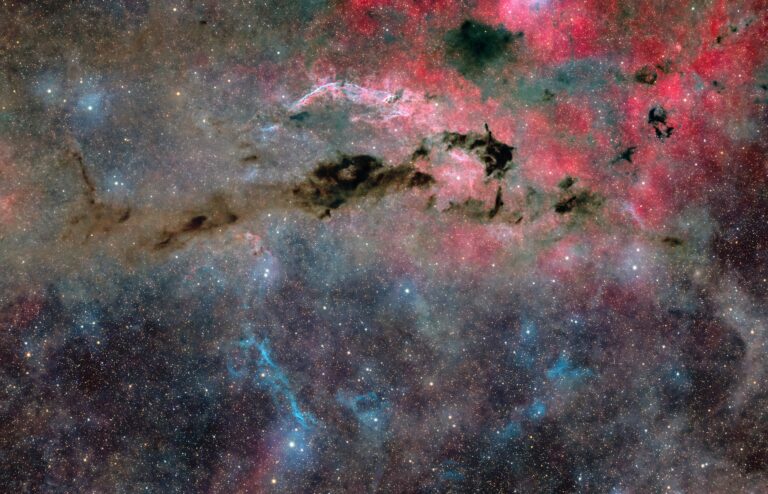
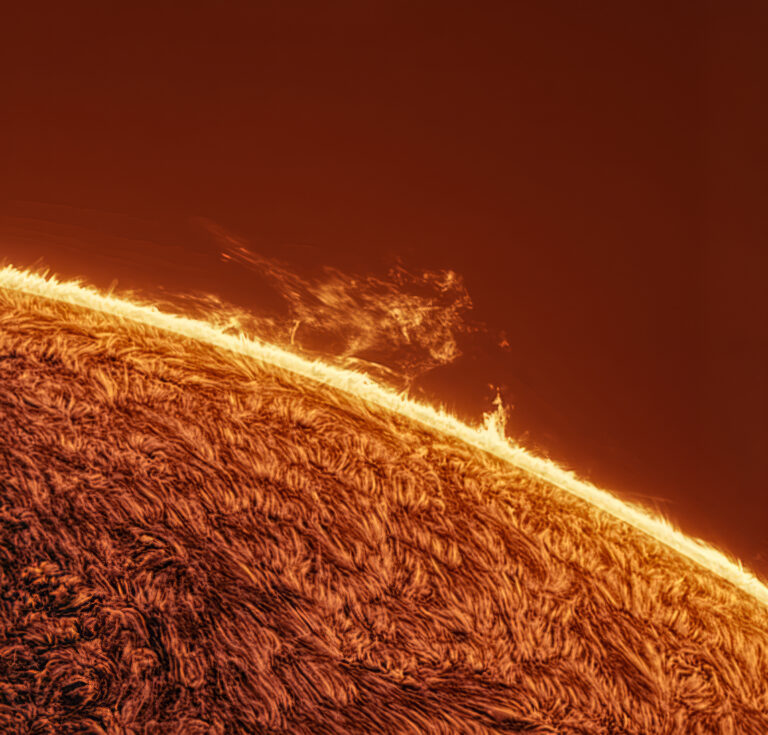
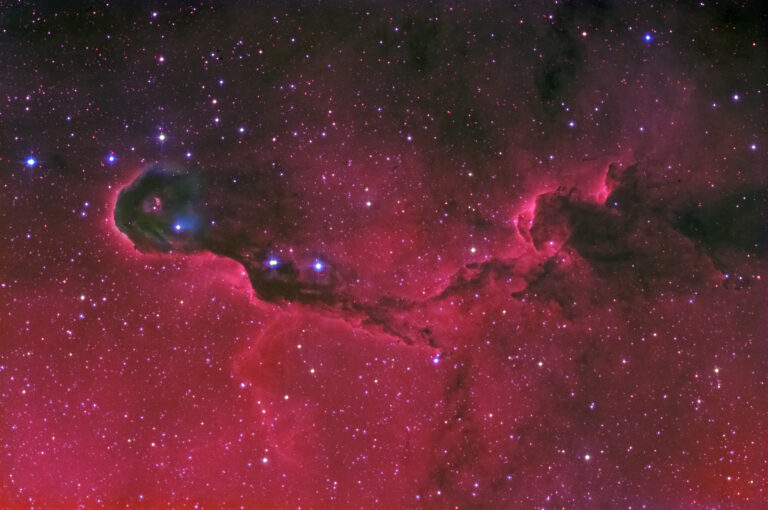
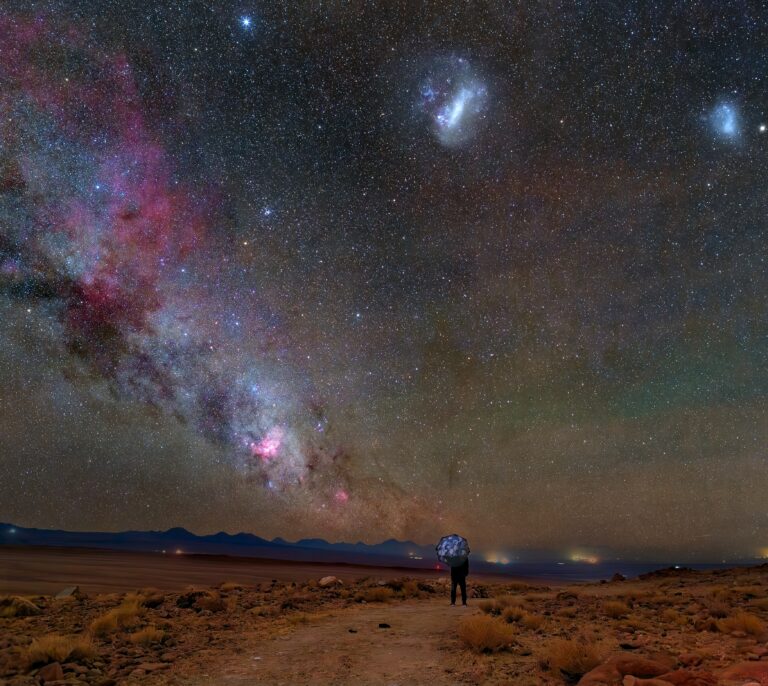
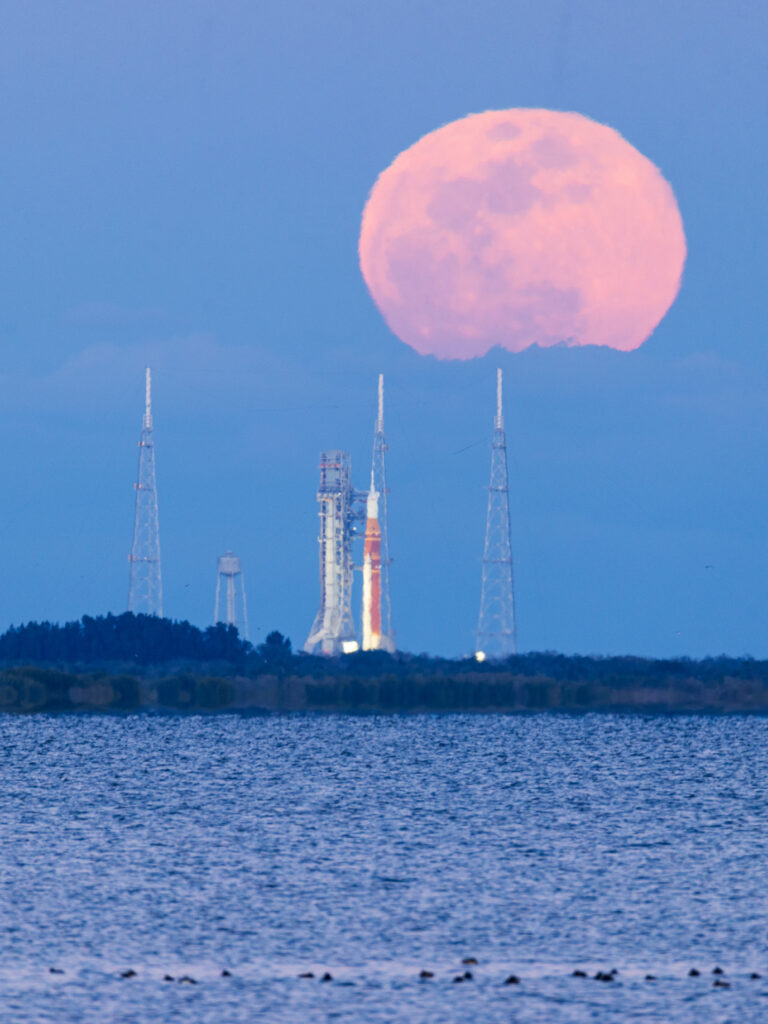
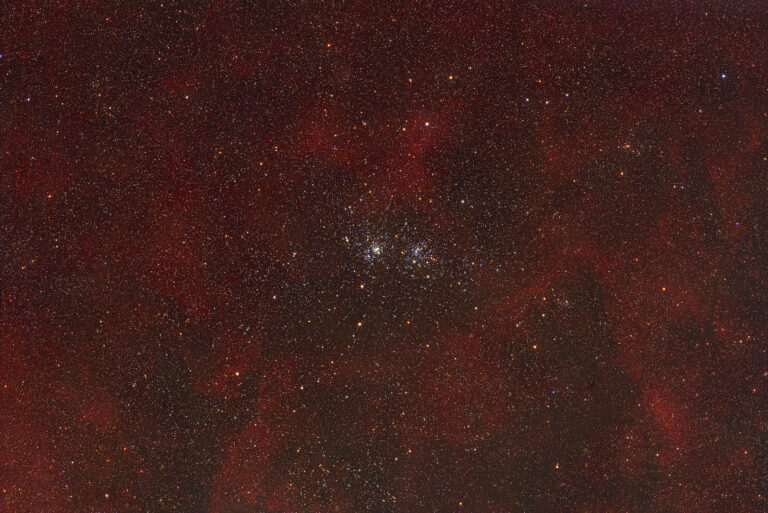
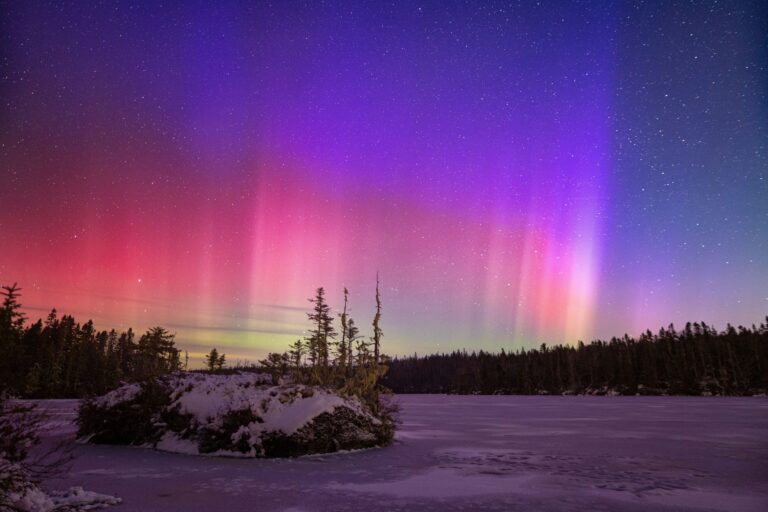
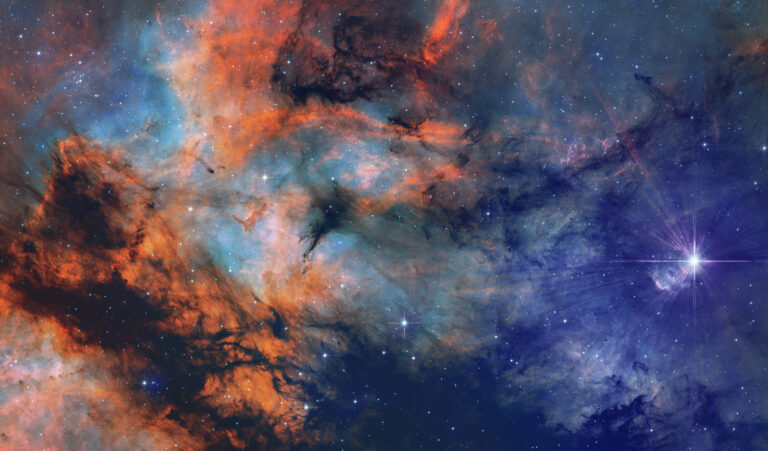
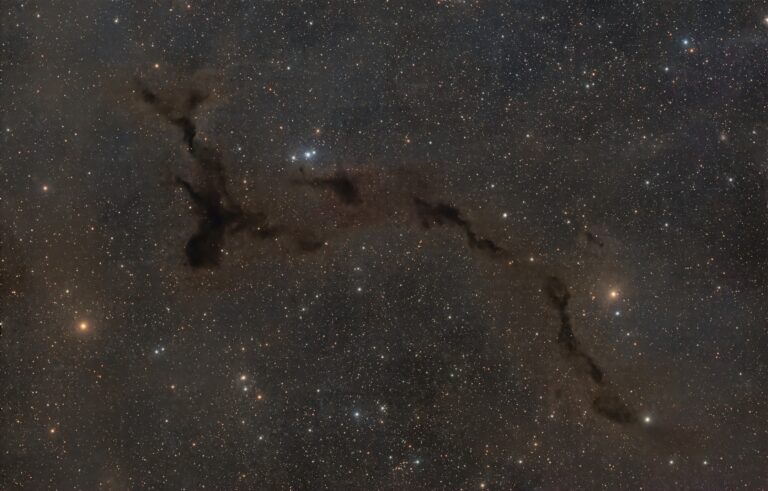
Decoding the cosmic microwave background
Wilkinson Microwave Anisotropy Probe (WMAP)
Cosmic Background Explorer (COBE)
This full-sky map from the Planck satellite shows the distribution of normal matter in our universe. It charts the location of matter between Earth and the observable edge of the universe, with darker regions representing greater mass and lighter regions representing less mass. The grayed-out regions are where light from the Milky Way blocked Planck’s ability to detect distant matter.
ESA and the Planck Collaboration
Planck mapped out the distortions in the CMB due to gravitational lensing caused by dark matter’s presence. This all-sky map shows where the dark matter is in the universe; darker blue areas show greater dark matter density, and lighter colors show areas of less dark matter density. Grayed-out regions are where light from the Milky Way and other nearby galaxies blocked Planck’s ability to take measurements.
Astronomy: Roen Kelly, after Fixsen et al. 1996
In 1990, the Far Infrared Absolute Spectrophotometer (FIRAS) instrument on COBE measured the spectrum of the CMB in frequency versus intensity to measure the temperature of the CMB and compare it to the temperature predicted by the hot Big Bang theory. The result, based on 43 measurements at equal spacing along the curve, matches the theoretical expectation so exactly that the data points fall precisely on the curve, with uncertainties that are smaller than the width of the blue line used to draw it.
Astronomy: Roen Kelly, after Wayne Hu
The power spectrum of the CMB measures the scales over which temperature variations in the CMB occur. This figure shows the size of temperature fluctuations in the CMB (in microkelvins) plotted against the multipole moment (l), which is a measure of the scale over which the fluctuations are seen. The peaks hold information about the curvature of space-time and the amounts of normal and dark matter in the universe, as well as constrain the type of dark matter present.