Thanks to ESA’s Venus Express data, scientists obtained the first large-area temperature maps of the southern hemisphere of the inhospitable, lead-melting surface of Venus.
The new data may help with searching and identifying ‘hot spots’ on the surface, considered to be possible signs of active volcanism on the planet.
The results, presented today at the American Geophysical Union (AGU) assembly in San Francisco, USA, were obtained thanks to VIRTIS, the Visible and Infrared Thermal Imaging Spectrometer on board Venus Express.
To obtain this fundamental information about the surface temperature, VIRTIS made use of the so-called infrared spectral ‘windows’ present in the Venusian atmosphere. Through these ‘windows’ thermal radiation at specific wavelengths can leak from the deepest atmospheric layers, pass through the dense cloud curtain situated at about 60 kilometres altitude, and then escape to space, where it can be detected by instruments like VIRTIS. In this way VIRTIS succeeded in looking through the thick carbon dioxide curtain surrounding Venus and detected the heat directly emitted by the hot rocks on the ground.
“We are very excited about these results, as they represent a very important item in the list of Venus Express’ and VIRTIS’ scientific objectives at Venus”, says Giuseppe Piccioni, one of the Principal Investigators of the VIRTIS experiment, from the Istituto di Astrofisica Spaziale e Fisica Cosmica in Rome, Italy.
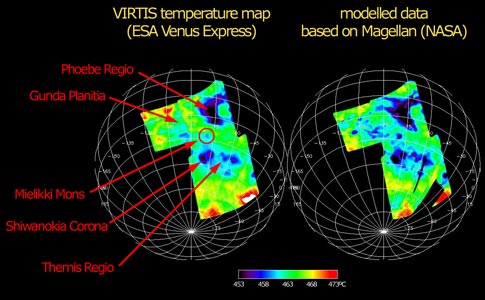
The measurements, made in August 2006 over the Themis and Phoebe Regions in the southern hemisphere of Venus, reveal temperature variations of 30 degrees between lowlands and mountain tops, correlating well with existing topographical radar data from previous missions. The Themis Region is a highland plateau located at 270º East longitude and at about 37º South latitude. It is a region that has experienced strong volcanic activity, at least in the geologic past.
On Venus there are no day and night variations of the surface temperature. The heat is globally ‘trapped’ under the carbon-dioxide atmosphere, with pressure 90 times higher than on Earth. Instead, the main temperature variation is due to topography. Just like on Earth, mountain tops are colder, whereas the lowlands are warmer. The ‘only’ difference is that on Venus ‘cold’ means 447º Celsius, while ‘warm’ means 477º Celsius. Such high temperatures are caused by the strongest greenhouse effect found in the Solar System.
“The VIRTIS results represent a major step forward in our attempt to identify specific surface features on the surface of Venus”, said Jörn Helbert from the German Aerospace Center’s (DLR) Institute of Planetary Research in Berlin, Germany, and a member of the VIRTIS team. “By ‘peeling’ off the atmospheric layers from the VIRTIS data, we can finally measure the surface temperature,” Helbert added.
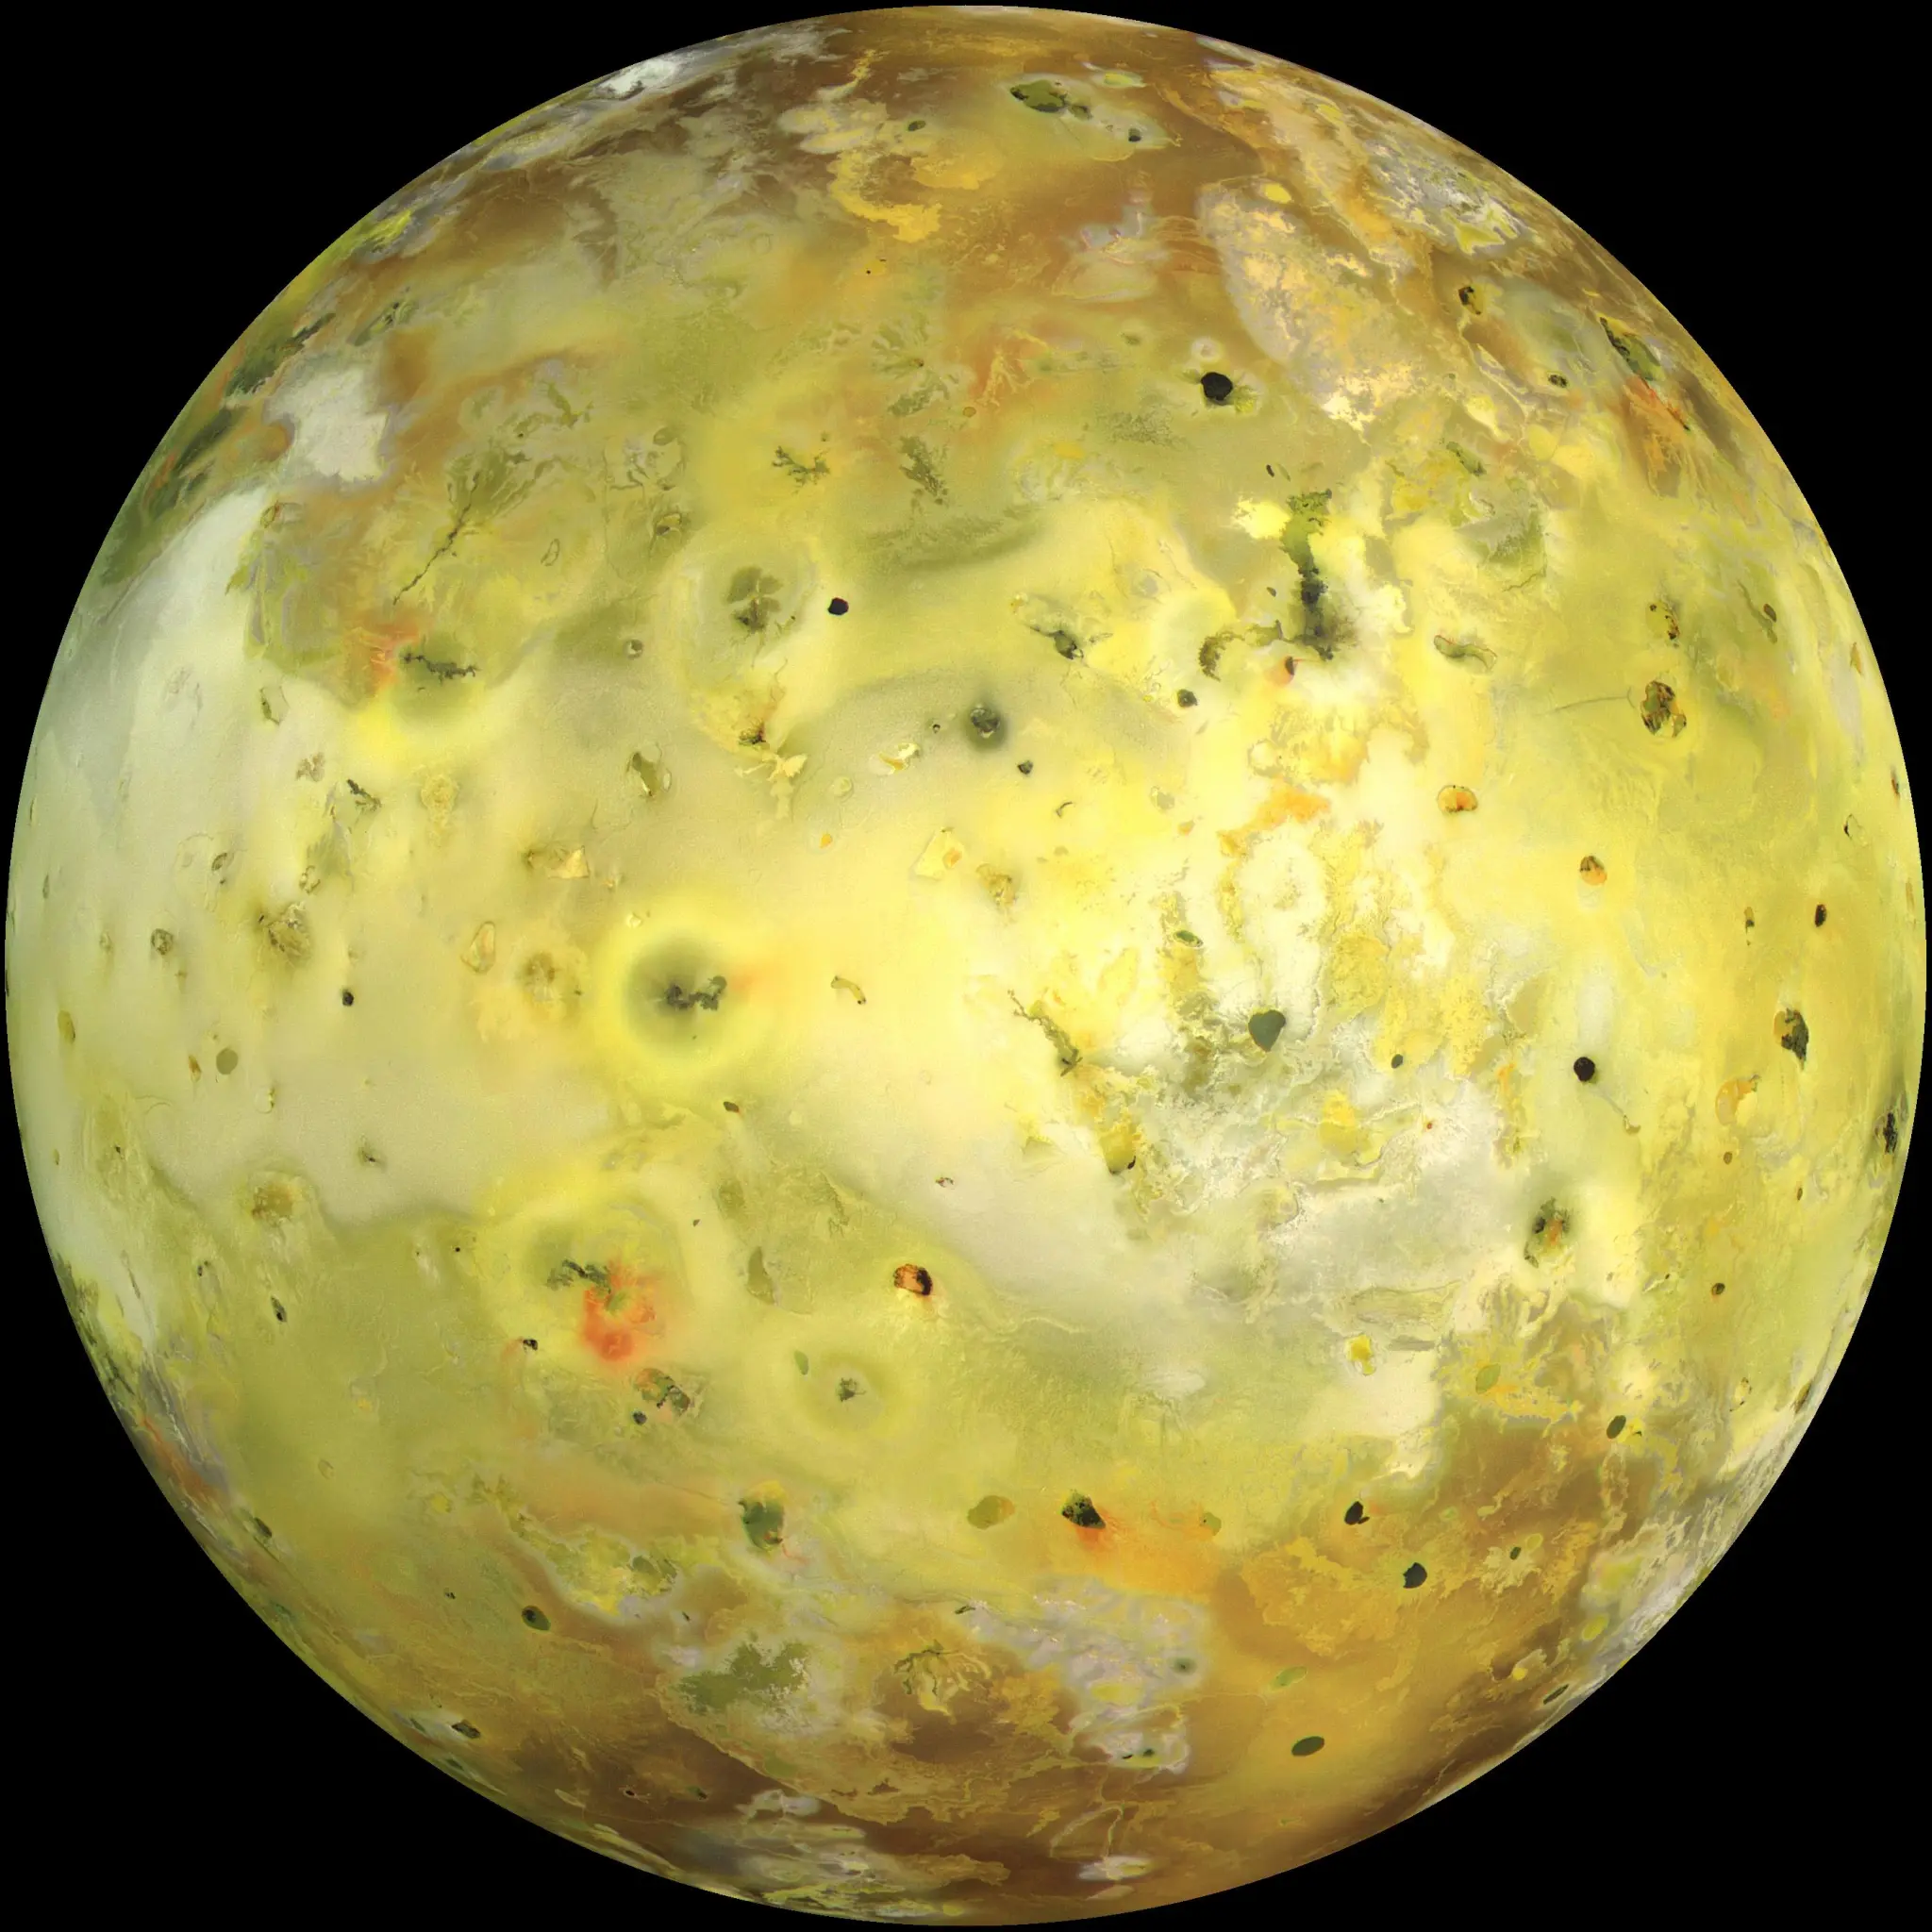
Eventually, the VIRTIS team hopes to identify ‘hot spots’ on the surface of Venus, possibly stemming from active volcanoes. In the Solar System, besides Earth, active volcanoes have been observed only on Io, a satellite of Jupiter, on Neptune’s satellite Triton, and on Saturn’s moon Enceladus (in the form of the so-called ‘cryo-volcanism’). Venus is the most likely planet to host other active volcanoes.
In order to achieve this, the Venus Express scientists started comparing the maps of the Venusian topography obtained by NASA’s Magellan orbiter in the early 1990s with the data gathered by VIRTIS. The Magellan topography maps allow for a rough prediction of the surface temperature, too. Comparing these predictions with the measurements made by VIRTIS allows searching for hot spots that show even higher temperatures than the oven-hot surface, possibly indicative of active volcanism.
This direct interdependence between temperature and topography will enable scientists to derive new topography maps of the Venusian surface from temperature measurements. This will help in complementing the Magellan maps.
“Actually, when comparing our temperature map with topographical data from Magellan, we are not only obtaining quite a good agreement, but we can even fill gaps that the Magellan and Venera 15 radar data sets left open”, concluded Pierre Drossart, the other Principal Investigator of the VIRTIS experiment, from the Observatoire de Paris Meudon, France.